

Agenda

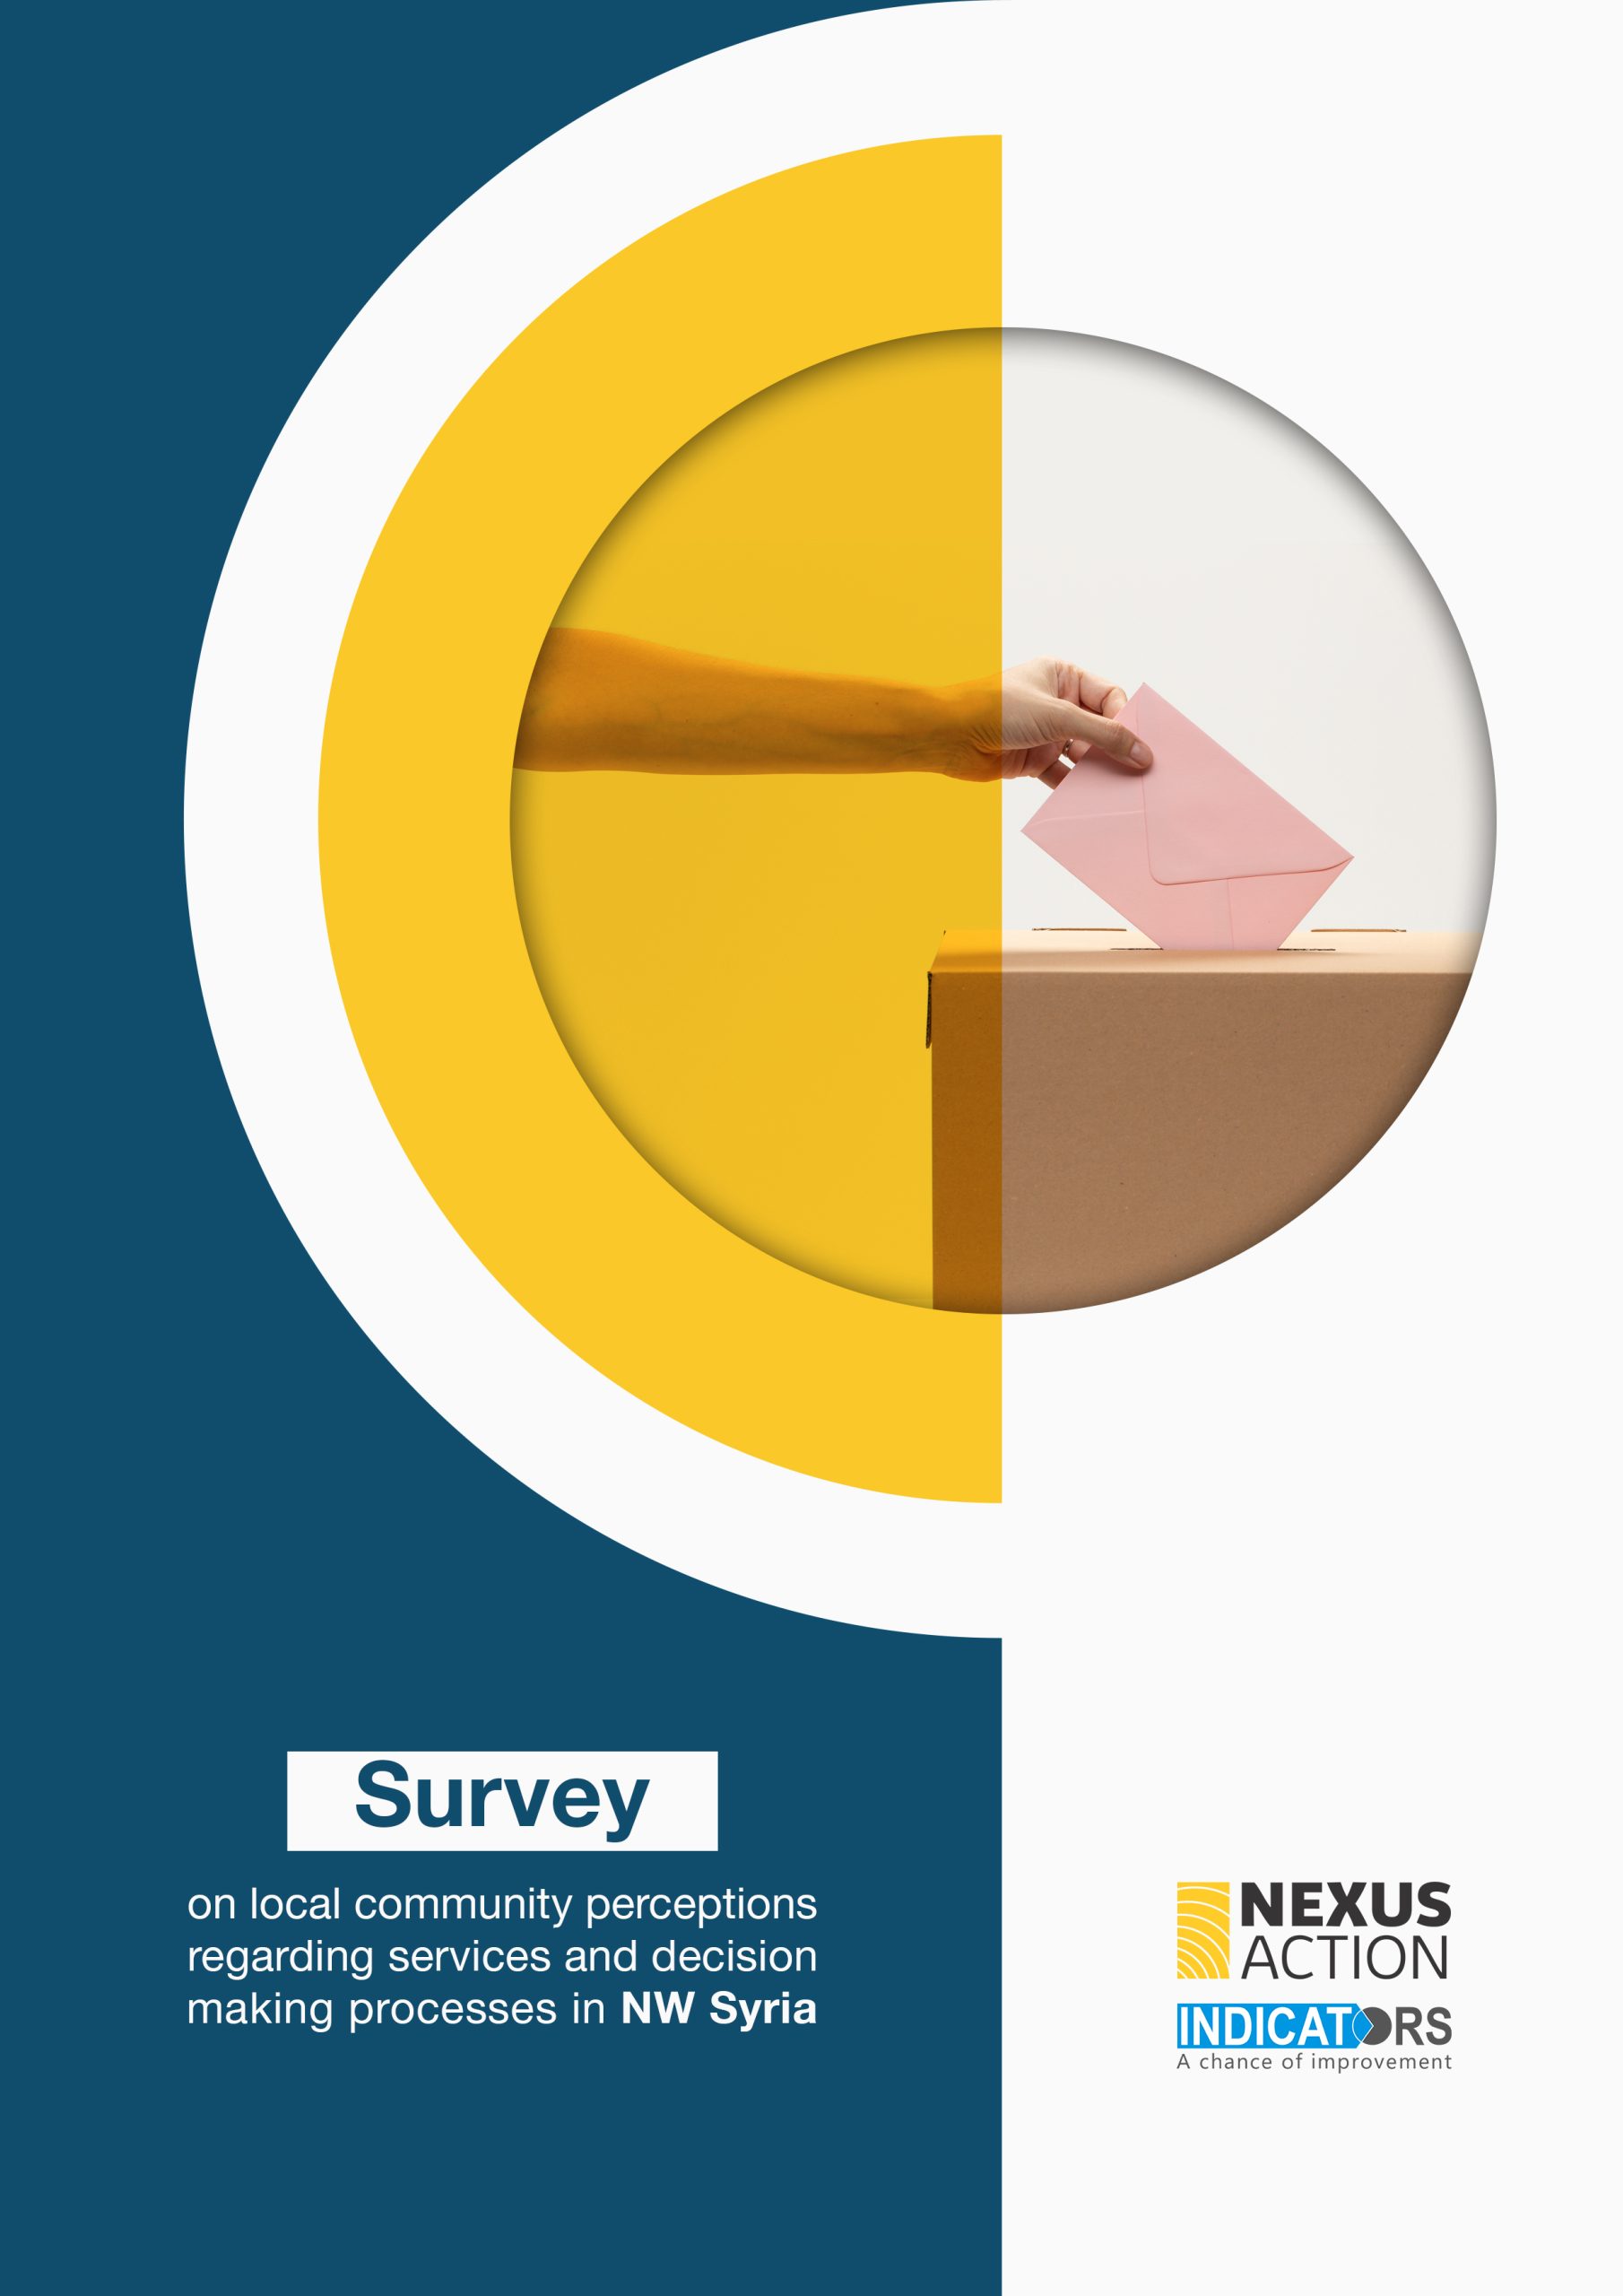
Large territories in northern Syria have been controlled by various opposition and other forces and non-state actors, after these territories were liberated from the control of the Syrian regime. While these entities govern the liberated areas, and are in charge of the affairs of the Syrians residing there by providing public services, maintain security, and resolve disputes, it is important to note that there is no single administrative and military entity which has a monopoly of control across the different parts of the region.
The present study was conducted to find out the reality of the liberated Syrian north, through identifying the entities responsible for governing each of these pieces of land, the status of public service provision and the level of citizen satisfaction, as well as understanding the state of affairs in terms of security, criminality, access to justice, and rule of law. Finally, the study aims to shed light to the decision-making mechanisms for important issues within the region, the extent to which citizens can participate in these mechanisms, and external influence on the governance and decision-making processes of the region.
The research has been designed and executed during the first half of 2021 in Idlib, Olive Branch and Euphrates Shield areas. It is based on field research involving survey of Syrians both from host communities and internally displaced persons (IDP’s) residing in the research area, and complemented with interviews with key informants (KIIs) from local government bodies or non-government organizations (NGOs).
The results of the study demonstrate a low level of knowledge of the residents of northern Syria of those responsible for governance and the provision of public services, mainly due to confusion between service providers and those responsible for managing the sector concerned. Another important result is in general, the residents of the region have low level of satisfaction for the services provided, which is being observed across all three regions.
Local Community Perceptions Regarding Services and Decision Making Processes in NW Syria
With regard to the security situation, Idlib was the safest area according to the opinions of key informants and participants in the survey, where Hay’at Tahrir Al Sham was able to firmly control the security situation in the area and deal to a large extent with the security threats of bombings and kidnappings. Theft remains the main security concern in Idlib. In the areas of Euphrates Shield and Olive Branch, the level of safety was found to be very low, where both areas suffer from explosions targeting markets and residential areas as well as many cases of theft, kidnappings, killings and factional fighting. The people of Olive Branch area suffer especially from the seizing of their rights and property by military factions, and are being subject to arbitrarily arrest and kidnapping and have to pay funds get released.
view of the importance of working to achieve the integration of Syrian refugees into Turkish society, to reduce the tension among Turks towards the Syrians, and to determine the role of the Turkish language in achieving that integration, we have conducted this study, which aims to reveal the level of mastering the Turkish language among Syrian refugees in Turkey, identifying the reasons that hinder their ability to learn the Turkish language, knowing the degree of integration of Syrians into Turkish society, and the impact of their mastery of the language on their integration and Turks acceptance of them. and to know the situation of Syrian refugees in Germany regarding learning the German language in order to benefit from the German experience in developing the language abilities and skills of Syrian refugees in Turkey.
The study was conducted during the second half of 2020 and covered the states of Istanbul, Gaziantep, Hatay, and Urfa, which are the states in which the largest number of Syrians reside. During the study, key informant interviews were conducted with key informants interested in refugees’ integration in Turkey and Germany, and questionnaires were conducted with 340 Syrians residing within the states covered by the study, and the study adopted a stratified random sampling method to ensure including Syrians according to several variables such as gender, age, and educational level
Given the severity of the IDPs in Syria being subjected to sexual or financial exploitation, we conducted a study in this regard, as we shed light on:
Showing the percentage of people who were subjected to exploitation and abuse by some humanitarian or relief sectors.
The reasons that made the victims of such abuses refrain from filing complaints.
The type and form of the abuse or exploitation they were subjected to
Their extent of their knowledge about how to get help and support in case they are subjected to such abuses.

Monitoring and Evaluation Department is considered one of the most important departments in NGOs, as it has an essential role in all phases of the project, starting from the planning of activities through assessing the needs of the targeted beneficiaries of the organization’s activities, and during the implementation phase and field follow-up, and even after the project ends through the process of final evaluation of the project and its impact assessment, and concluding lessons learned that can contribute to designing and developing future projects that the organization intends to implement, in addition to the role of the department in raising the degree of donors’ confidence in the organization.
Given the importance of the Work of MEAL Departments in NGOs, we conducted this study, which aims to identify the situation of the work of the M&E departments in Syrian organizations operating in Turkey, the extent to which these departments are organized, the existence of policies and SOP’s guides, its effectiveness within the organization and their relationship with the rest of the organization’s departments, in addition to identifying the expertise and competencies that workers of these departments possess and their most important training needs. The study included 20 Syrian organizations located in both Gaziantep and Istanbul.
The study showed that the Work of MEAL Departments in the majority of Syrian NGOs is limited to monitoring and evaluation only, without having a role in the accountability or learning process, and employees of these departments suffer a lack of expertise, especially expertise related to reports reporting, quality standards for questionnaires, sampling methodologies and PSEA, also, the vast majority of organizations lack policies and SOPs guides, in addition to the weak relationship and coordination between the M&E departments and the programs departments in about half of the organizations.
The study was conducted during October and November 2021.
The constitution is of great importance in the legal system of countries since it is the supreme law of the country, and it includes the general and basic rules that define the form of the state (simple or complex), the type of ruling in it (monarchy or republican) and the form of government (presidential, parliamentary or mixed). The constitution also regulates the general authorities (legislative, judicial and executive) in which the state carries out its tasks, the jurisdiction of each of them, and the relationship of these authorities with each other, and clarifies the economic, social, political and cultural principles. The constitution also has a great impact on the citizens of countries, as it defines their rights, freedoms and duties, and stipulates the guarantees that guarantee these rights for them in the face of arbitrariness of the authority. The constitution has preponderance over all other legal rules in the state, which means that the state’s authorities must abide by its provisions when issuing any decisions or enacting any legislation, and that any other decisions or legislations that contradict it are null and void.
In Syria, and following the military coup carried out by Hafez Al-Assad in 1970 and his assumption of power, the permanent constitution of the republic was issued in 1973, and in fact the provisions and texts of that constitution were intended to consolidate the rule of Hafez Al-Assad and the Arab Socialist Baath Party, as Article 8 of the constitution affirmed that the Baath Party is the leading party of the society and the state, and that it leads the National Progressive Front that includes other political parties in the country. The 1973 Constitution has also granted the President of the Republic great powers that make him able to interfere in the work of all state authorities in a way that hollows the concept of the principle of separation of authorities from any content or meaning.
With the outbreak of public protests in Syria in March of 2011 and the expansion of their geographical area, the Syrian regime undertook some nominal reforms, including the adoption of a new constitution for Syria in 2012, which abolished Article 8 of the 1973 Constitution and stipulated party pluralism in Syria, but it has preserved the great and semi-absolute powers of the head of state, as he is the head of the executive authority and has the power to unilaterally issue legislations or block the passage of legislations decided by the People’s Assembly. He is also the president of the Supreme Judicial Council which appoints judges of the Supreme Constitutional Court, and he is also the supreme commander of the Army and Armed Forces, in addition to other powers such as appointing civil and military employees and conducting referendum of the people in cases considered to be contradicting the constitution, in addition to the seven-year electoral cycle that is open to repetition.
Objectives:
The study aims to explore the views of Syrian activists, community leaders and jurists, other influential people within the Syrian society, and people who are interested in political affairs, on the most important constitutional principles that they believe should be stipulated in the new constitution, which is currently being drafted, with the aim of presenting a clear conception for members of the Constitutional Committee on the aspirations and desires of Syrians to be taken into account during committee meetings and discussions that take place within the framework of the constitution drafting process.
Since the early years of the conflict in Syria, the international community has sought reaching a political solution to end the current state of violence in the country. In 2012, the Action Group for Syria held its talks in the Swiss city of Geneva which was headed by the then UN envoy to Syria, Kofi Annan, who announced after the conclusion of the talks that the meeting has issued a detailed statement known as the Geneva 1 statement, which stressed the need to pressure all parties to implement the six-point plan (the Annan plan) . The statement also condemned the continuation and escalation of combat operations, destruction, and human rights violations, and recommended the commitment of all parties to cease armed violence and intensify the pace of release of the arbitrarily detained people, and called for the formation of a transitional governing body and the review of the constitutional system and the legal system in Syria.
Later, on the 18th of December 2015, the Security Council unanimously approved Resolution No. 2254, which outlined the features of a political solution in Syria, as the resolution affirmed that the Syrian people is the party which shall decide the future of the country, demanded ceasing attacks on civilians, and stipulated that the United Nations Secretary-General shall call each of the representatives of the regime and the Syrian negotiating committee to participate in formal negotiations on the path towards the political transition. The resolution also expressed its support for the commencement of a Syrian-led political process facilitated by the United Nations that establishes a credible governance that includes everyone and is not based on sectarianism, and sets a timetable for drafting a new constitution for the country and conducting free and fair elections pursuant to the new constitution and under the supervision of the United Nations in a safe and neutral environment including all Syrians including those living in exile.
In fact, it can be said that none of the items of the statements and decisions related to the path of the political solution in Syria have been practically implemented due to the regime’s procrastination and its unwillingness to enter that path seriously, which led to the prolongation of the political process, which went through several rounds of talks. The roadmap for a political solution in Syria was adopted in 2017 based on UN resolutions 2254 of 2015 and 2118 of 2013 containing the Geneva Declaration. This roadmap stipulated the work in parallel or successively on the following four axes: governance, constitution, elections, and a safe and neutral environment. In this context, the Sochi Conference affirmed its support for the implementation of Security Council Resolution No. 2254 and called on the United Nations to form the Constitutional Committee as a contribution to the United Nations-led political process in Geneva, and to the implementation of Security Council Resolution No. 2254 of 2015, accordingly, the United Nations conducted indirect negotiations between the regime’s government and the Syrian Negotiating Committee to form the Constitutional Committee and to agree its reference standards and the basic elements of its internal regulations.
Objectives:
This study aims to identify the views of Syrians of all sects and components about the Constitutional Committee and its work and to identify the issues that are a priority for them regarding the path of a political solution in Syria, including working on drafting a new constitution for the country and revealing the extent of their confidence in the work of the Constitutional Committee and its ability to advance the political process and to identify their restrictions about its work and method of formation.
The study also aims to identify the Syrians’ position on the three delegations of the Constitutional Committee (the delegation of the Syrian government – the delegation of the opposition – the delegation of the civil society) and to identify the most prominent means they believe that it can increase their ability to communicate their desires and aspirations to the members of the Constitutional Committee to be taken into consideration when drafting constitutional texts. The study also aims to identify the views of Syrians about some constitutional issues, such as the Arab identity of the Syrian Republic, the relationship of the state with the religion, the relationship of state authorities to each other, and women’s issues.
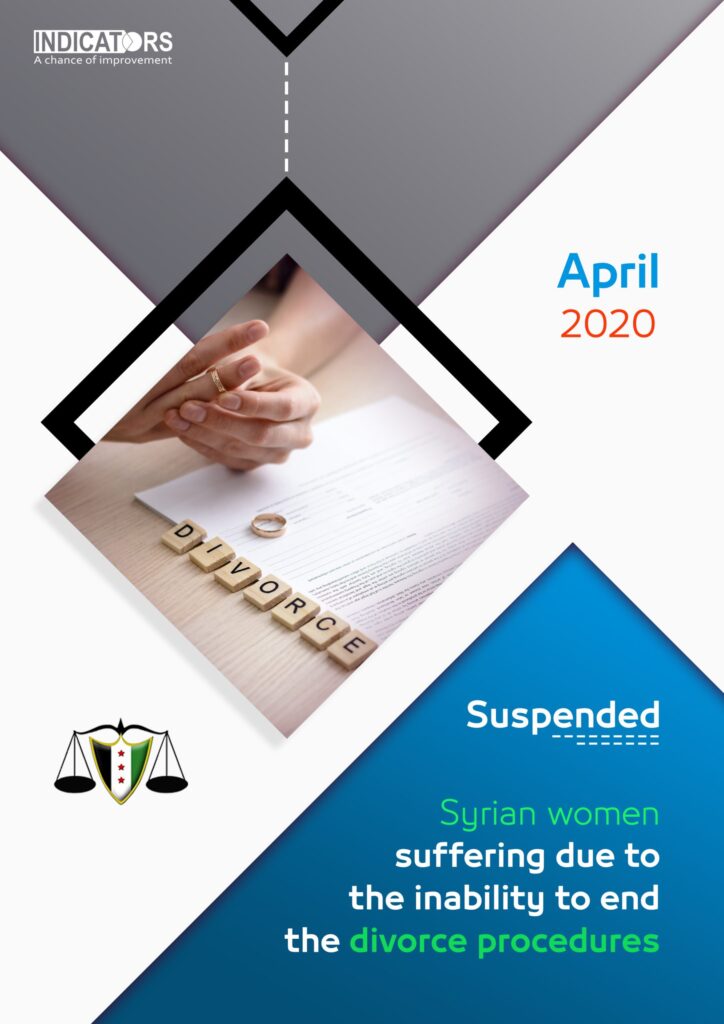
SUSPENDED WOMEN
Reports and statistics issued by international human rights organizations and bodies indicate that there are huge numbers of Syrians who have been forced to leave their home areas to become internally displaced or to take refuge in other countries, as the Syrian Observatory for Human Rights estimates the number of internally displaced people to 6.6 million people, while the number of refugees was 5.6 million people who are mostly located in neighboring countries, especially Turkey, which hosts between three million and a half and four million refugees. Syrians living in areas that are out of regime’s control inside Syria, whether they are IDPs or members of the host community suffer many difficulties related to their inability to reach the official state departments to obtain ID documents they need or to document any changes in their personal status such as marriage and divorce contracts, because the Syrian regime closed many official departments in areas out of its control. Refugees also face many difficulties, especially because many countries stopped the diplomatic missions affiliated with the Syrian regime, and the rest of these missions require many documents (that refugees cannot obtain) to complete the required procedures for registering personal status documents such as marriage and divorce. There is no doubt that these difficulties are more difficult for the most vulnerable groups, especially the divorced women.
SUSPENDED WOMEN
Based on the above, given the importance of registering marriage and divorce contracts and the consequent legal problems resulted from not registering them at the official authorities in addition the loss of the rights of the wife and children, we have conducted this study, which aims to research the situation of divorced women residing in Turkey and to know the percentage of marriage and divorce contracts registered at the official authorities, and to identify the most prominent procedures used to register marriage and divorce contracts in addition to know the negative effects of not registering them on both the wife and children. The study also aims to reveal the difficulties and challenges faced by divorced women on the economic and social levels.
Objectives:
The study aims to research the situation of divorced women residing in Turkey and to determine the legal options available to them to register their marriage contracts or divorce cases at the official authorities in both Syria and Turkey, and to reveal the most important difficulties and challenges facing them on the various aspects such as social, financial and legal aspects
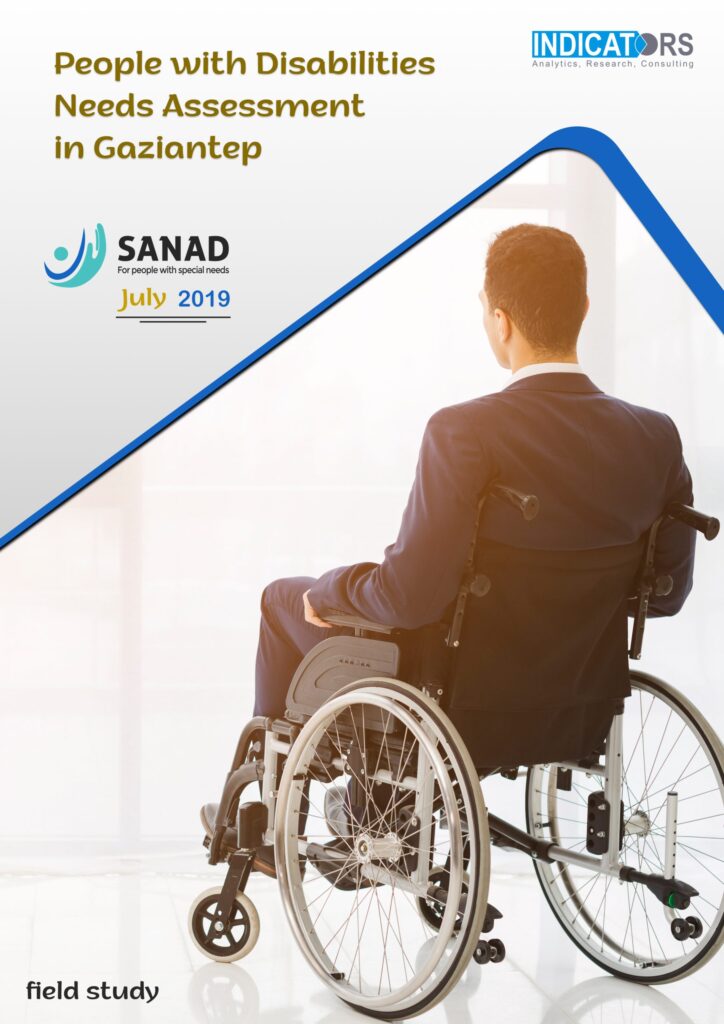
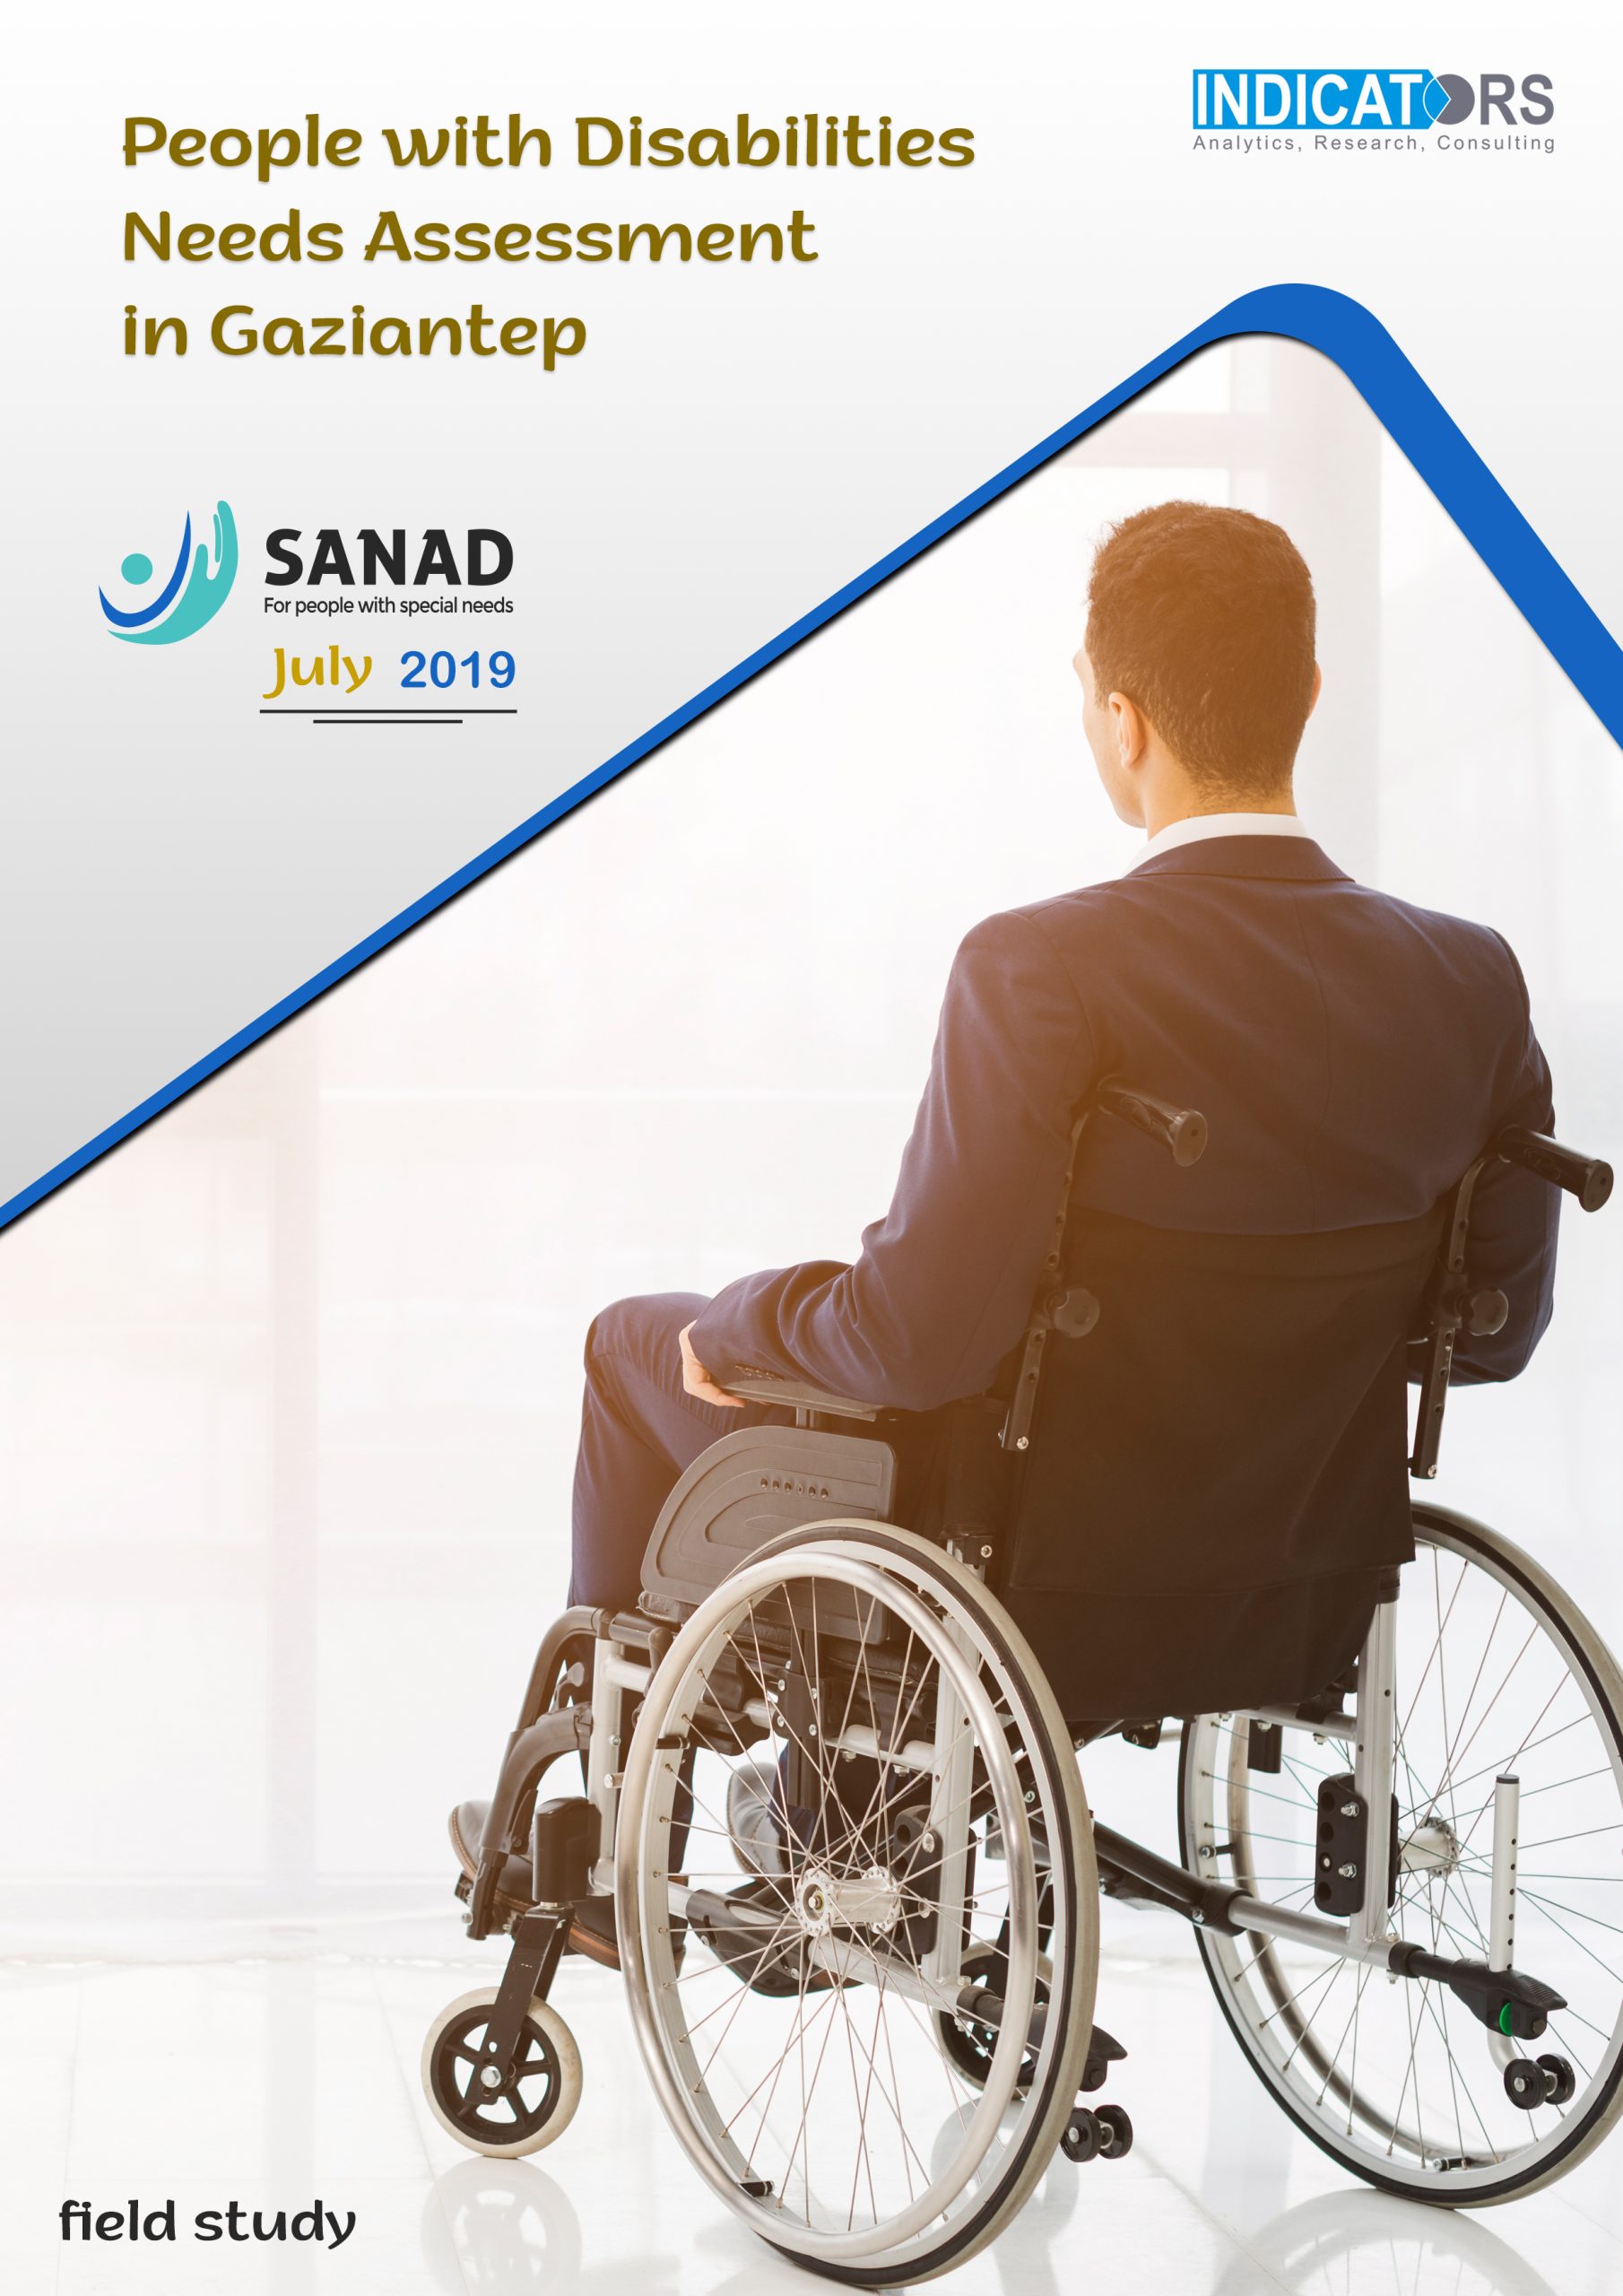
Reports by international bodies and organizations, indicate that the numbers of people with disabilities in Syria have risen dramatically during the conflict, with many Syrians suffering from injuries that left them with some kinds of disability. By the end of 2014, the World Health Organization (WHO) reported that there were nearly 1 million people with disabilities in Syria. That figure increased due to the war in the country, according to a report by the World Health Organization in 2017 about the needs of the Syrian people that there were 2.8 million people with permanent physical disabilities, of whom 86,000 their limbs were amputated.
As the fighting continues and the Syrian areas are being bombed and destroyed, waves of displacement and asylum in neighboring countries have increased. Turkey has the largest share of the estimated 3.5 million Syrian refugees, including those with disabilities. Syrian refugees in Turkey face difficult living conditions, such as high living costs, low job opportunities, low financial returns, and complicated procedures for extracting official documents such as temporary protection cards and work permits. Living conditions are particularly difficult for people with disabilities as society has low confidence in them and their capacity and poor funding from international donors to launch projects that seek to meet their needs and support them psychologically, healthily, and professionally.
Research objectives
The report aims to study the situation of people with disabilities residing in the Turkish city of Gaziantep to know their living conditions, their ability to integrate into society, and opportunities available to them in terms of work, education, capacity-building training, and health needs. Also, identify the most significant difficulties they are experiencing and to direct humanitarian support in a way that meets their requirements.
Research methodology
The data collection took place in July 2019 and included 1,337 people with disabilities living in the Turkish city of Gaziantep. A field survey for people with disabilities was conducted based on Sanad’s database. The interviews were carried out using a questionnaire with closed and half-open questions.
Due to the importance of personal identification documents and the negative consequences of not possessing them on the lives of individuals, this study was conducted, in order to reveal the numbers of Syrians who do not have personal identification documents, and to define the most prominent personal identification documents that Syrians suffer tremendously to obtain, while listing the negative consequences of not possessing them.
The study was conducted in the cities of Idlib and Salqeen in Syria, it also included the city of Urfa in Turkey and the regions of Arsal and the Bekaa in Lebanon, in which 305 male and female participated, taking into consideration while selecting them a number of variables such as status of residence, age and social status, and data collection was conducted using a questionnaire with closed-ended questions.
The results of the study showed that many Syrians, whether residing in the liberated areas or in the countries of refuge, do not possess the personal identity documents of all kinds, especially passports, civil registry record or educational documents.
Additionally, many Syrian children are still not registered at official state departments and many young people, who are more than fourteen years old, still do not possess IDs. Many Syrian have lost their personal identification documents as a result of the bombing of their areas or during displacement, or it was confiscated or destroyed by the various military bodies and forces dominated by the Syrian regime.
The fear of being arrested by the pro-regime forces prohibited many Syrians from traveling to regime areas which constituted the main reason for the Syrians’ inability to obtain any official document. In addition to the fact that many of them cannot afford paying for these documents, considering that paying bribes to employees of the governmental institutions or hiring a lawyer is the most common ways to obtain these documents.
As for the negative outcomes of the non-possession of official documents and not registering personal affairs documents in the official government departments, the most concerning issue is depriving unregistered children from their nationality, particularly in the event of the inability to register the marriage documents, and the inability of people without personal IDs to vote or run for public services jobs or state departments jobs, in addition to depriving them of many of their most basic rights that people cannot live properly without it, such as the right to education, the right to work, the prevention of travel and the restriction of individual freedom and deprivation of health care.
Peace polls first appeared in 1996 by the British researcher Colin Irwin, at that time Ireland was suffering from internal conflicts, when Colin decided with a number of researchers to launch an opinion poll to help stop the fighting. Indeed, peace polls played an important role in peacemaking in Northern Ireland, where eight public opinion surveys were conducted to support the peace process between April 1996 and May 2000. These surveys have played the most prominent role in determining the issues of interest to the conflicting parties and knowing their opinions regarding the situation and how It should be, thus finding the points of consensus in order to build on them, consequently reaching a solution that is acceptable for all.
Peace polls were used in many other conflicts, such as in the Balkans, Serbia, Darfur, and others. Although the ultimate goal of the peace polls was not achieved by reaching a solution that would end the conflict on many issues, yet it had a positive impact and contributed to advancing negotiations and peacebuilding.
Peace polls are defined as opinion polls conducted in conflict zones and designed to measure the public’s views and opinions on a particular topic or a series of controversial topics, in order to seek common ground to enable the conflicting parties to build a consensus out of the conflict situation, which contributes to greater political stability and economic prosperity and increases the degree of social cohesion.
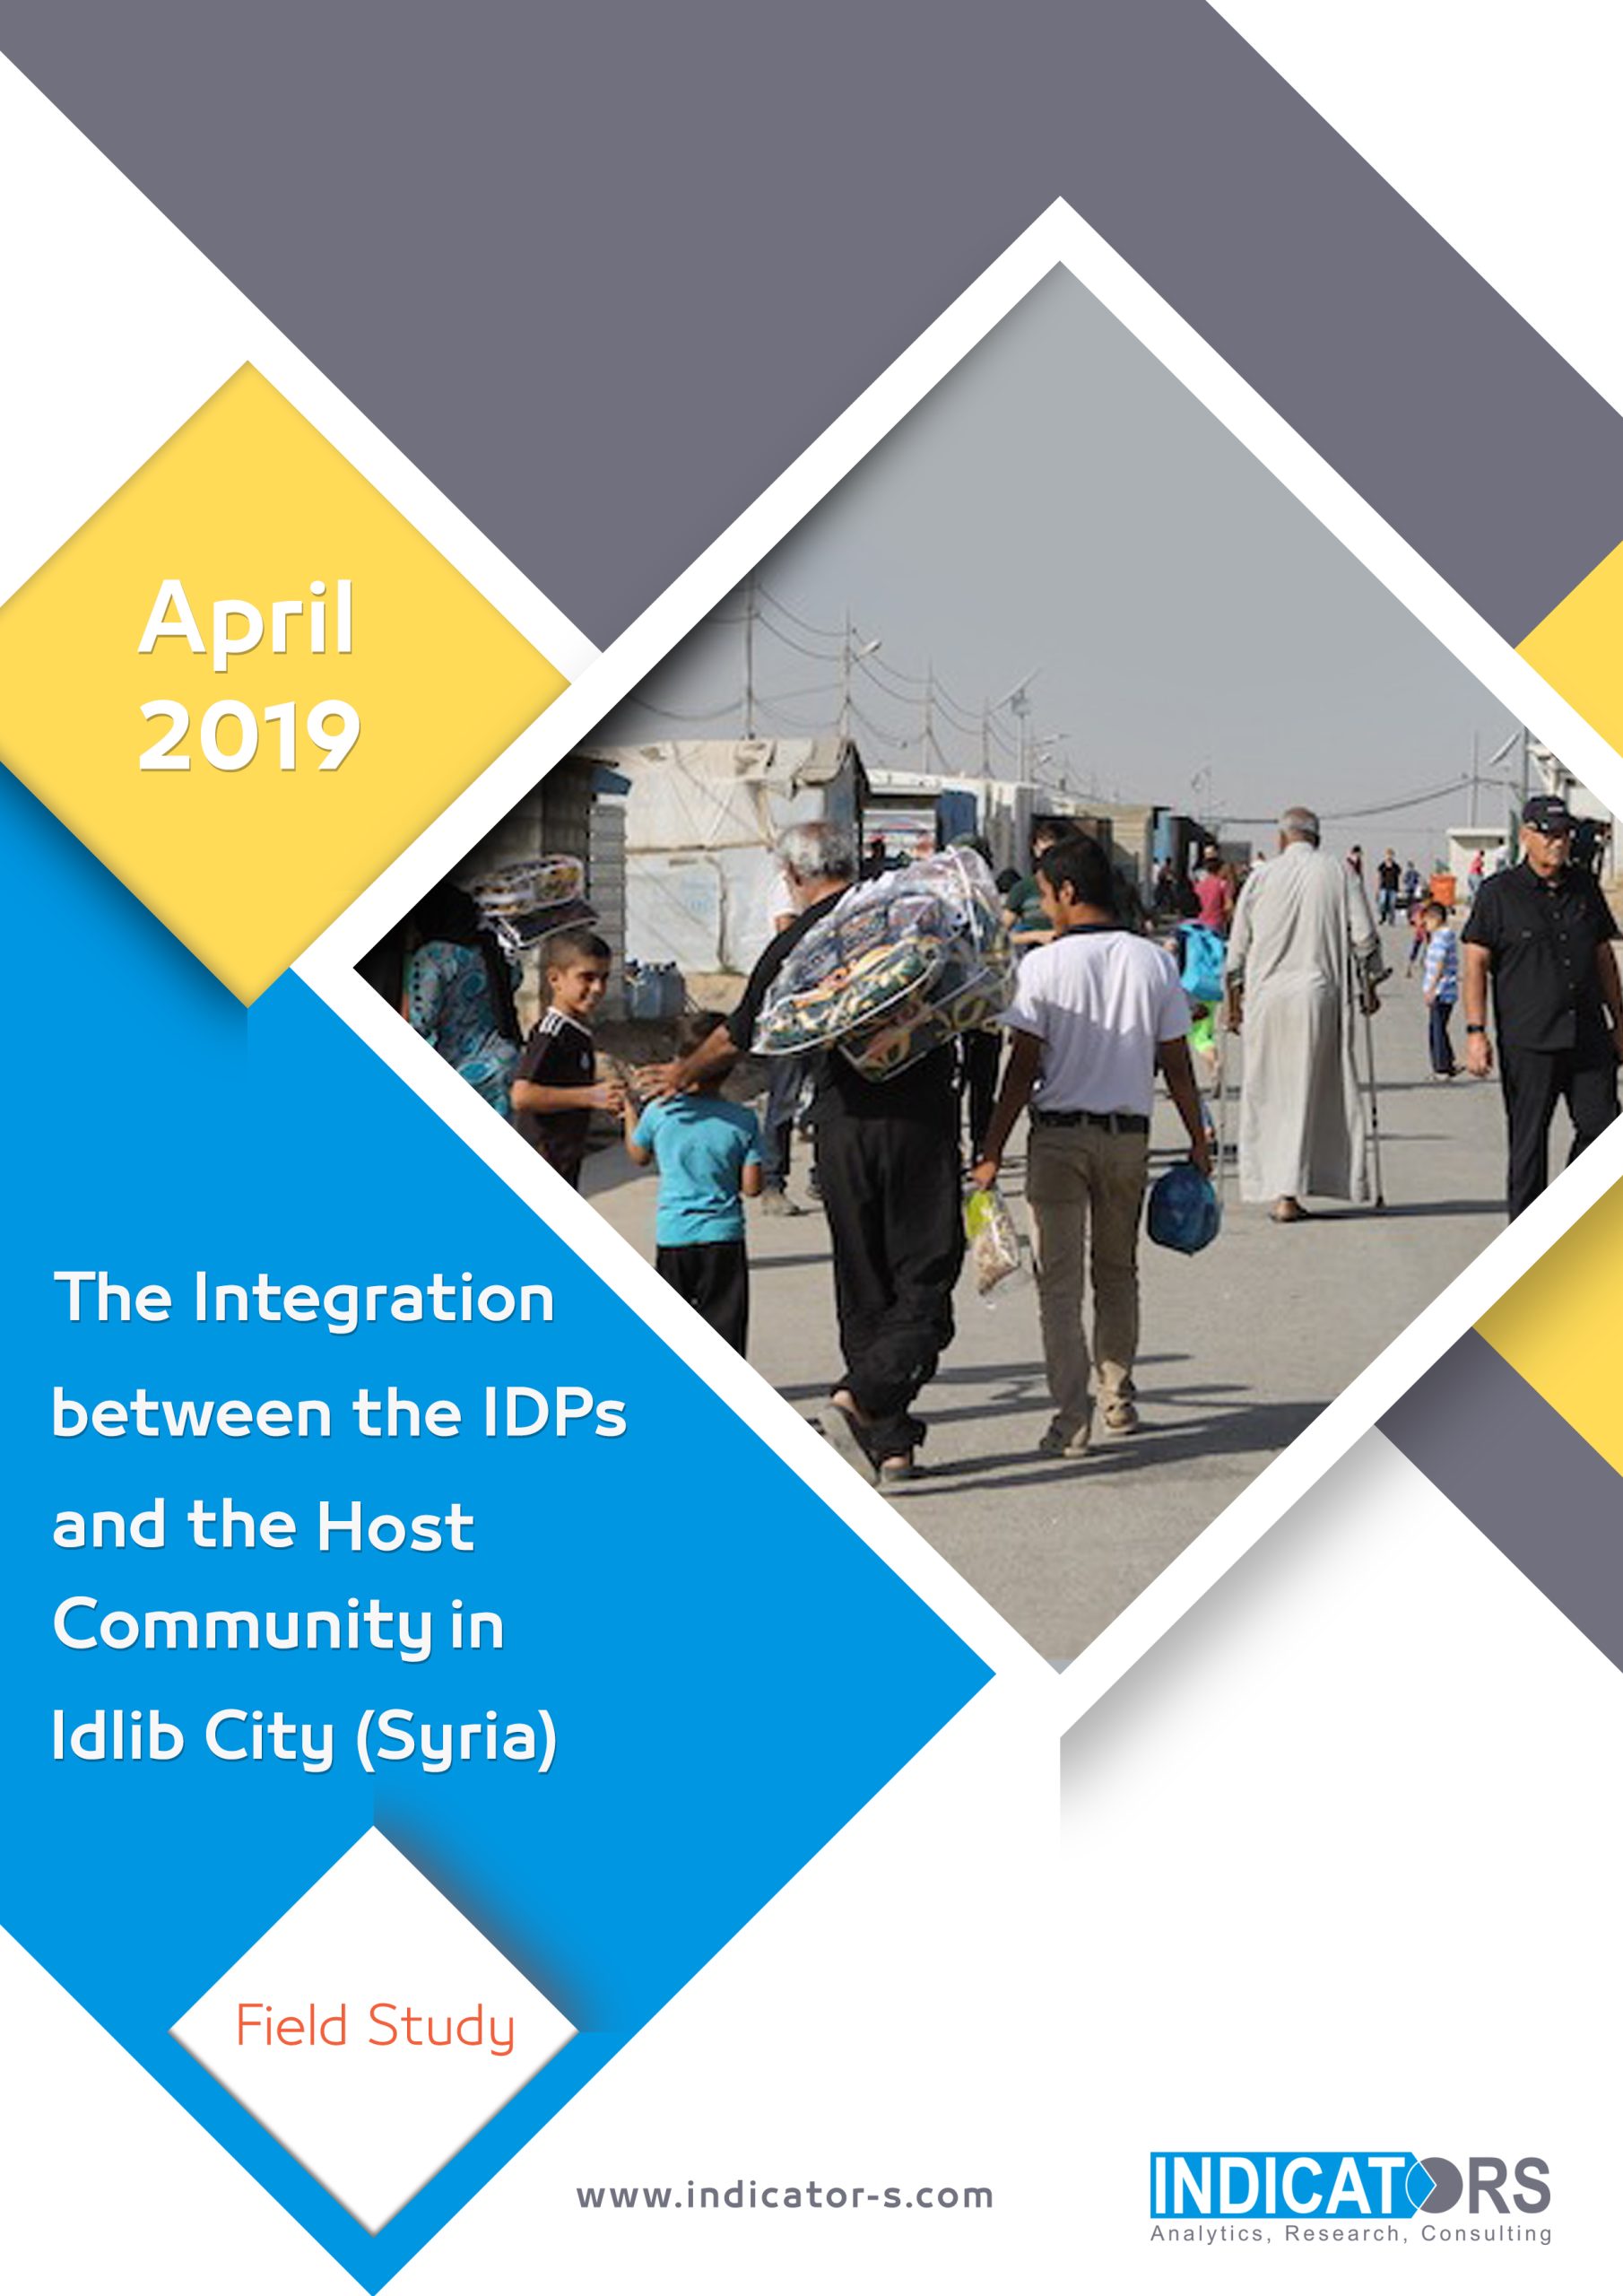
THE INTEGRATION BETWEEN THE IDPs AND THE HOST COMMUNITY IN IDLEB CITY
Based on the main objective of peace polls, which is to promote the values of coexistence and find solutions to the problems that increase tensions within the community in addition to overcoming the obstacles that would increase the state of division, this study was conducted within the city of Idlib and among the members of the host community and IDPs from different Syrian regions, to identify the main problems experienced by both parties that hinder the integration of the IDPs people within the community, and learn about each party’s desires from the other in order to ease the tension, if existed.
Peace polls first appeared in 1996 by the British researcher Colin Irwin, at that time Ireland was suffering from internal conflicts, when Colin decided with a number of researchers to launch an opinion poll to help stop the fighting. Indeed, peace polls played an important role in peacemaking in Northern Ireland, where eight public opinion surveys were conducted to support the peace process between April 1996 and May 2000. These surveys have played the most prominent role in determining the issues of interest to the conflicting parties and knowing their opinions regarding the situation and how It should be, thus finding the points of consensus in order to build on them, consequently reaching a solution that is acceptable for all.
Peace polls were used in many other conflicts, such as in the Balkans, Serbia, Darfur, and others. Although the ultimate goal of the peace polls was not achieved by reaching a solution that would end the conflict on many issues, yet it had a positive impact and contributed to advancing negotiations and peacebuilding.
Peace polls are defined as opinion polls conducted in conflict zones and designed to measure the public’s views and opinions on a particular topic or a series of controversial topics, in order to seek common ground to enable the conflicting parties to build a consensus out of the conflict situation, which contributes to greater political stability and economic prosperity and increases the degree of social cohesion.
Based on the main objective of peace polls, which is to promote the values of coexistence and find solutions to the problems that increase tensions within the community in addition to overcoming the obstacles that would increase the state of division, this study was conducted within the city of Idlib and among the members of the host community and IDPs from different Syrian regions, to identify the main problems experienced by both parties that hinder the integration of the IDPs people within the community, and learn about each party’s desires from the other in order to ease the tension, if existed.
According to United Nations statistics, 15% of the world’s population has disabilities, and they are suffering from several types of discrimination in their communities, or difficulties resulting in denying them from having equality with other people in having some of their basic rights, such as the right to education, the right to work and the right to freedom of movement. Knowing that all international conventions related to people with disabilities guarantee them these rights and promote equalizing them with other groups of society and states the necessity of removing obstacles that are hindering them from accessing the main services provided.
Regarding the effort to integrate people with disabilities into society and to preserve their basic rights, most countries enact laws that protect them from all forms of discrimination. However, in countries suffering from internal conflicts, where the role of state institutions is absent and their services in the areas that are out of their control are ceased, as in the case of Syria, where these state institutions are replaced by bodies, institutions, non-governmental organizations or humanitarian organizations that carry out the tasks of providing essential services to people affected by crises, without being abided by specific laws, but whose work is governed by the principle of working to meet the needs of the most vulnerable people and people with most urgent needs.
In this context, we wonder about the ability of humanitarian organizations to abide by the principles of humanitarian action, which is based on the need for equality between the groups affected by crises, especially in the Syrian situation, where we have a large number of affected people, including people with disabilities, whose number has significantly increased due to the current war to reach 2.8 million people who are physically disabled according to the United Nations estimates.
Therefore, we will discuss through this study the extent of the humanitarian organizations targeting for people with disabilities through the projects that they are implementing, and the extent to which they consider their most important requirements and needs, and to analyze their ability to identify the people with disabilities and deal with the challenges these organizations face when trying to reach them, with highlighting obstacles that confront people with disabilities in accessing the services provided by those organizations.


A series of guides for the data collectors to increase their skills in data collection for various research sectors.
Titles of the guides:
1. Data Collection ethics.
2. Individual and KI interviews.
3. Focus Group Discussion.
4. Field visit/Observation.
the fourth and final guide of the Field Heroes series, which provides an explanation of the appropriate mechanisms and procedures for collecting data through observation, which is usually done through a field visit to the project site.
The observation is one of the most important tools of data collection because it helps us to obtain information about the expressed needs, which are more credible than the felt needs of the people, and it’s also the main tool in the methodology of Design Thinking developed by Ideo to help create innovative products.

A series of guides for the data collectors to increase their skills in data collection for various research sectors.
Titles of the guides:
1. Data Collection ethics.
2. Individual and KI interviews.
3. Focus Group Discussion.
4. Field visit/Observation.
the third guide from the Field Heroes series is focus group discussions FGDs, which aims to develop the skills of enumerators and researchers in this field.
focus group discussions FGDs considers one of the hardest tools in data collection in terms of facilitating the session and ensuring the orientation of the discussions in a way that helps to obtain the data intended for the session, in addition to the sensitive role of the documented session and the ability to discuss and record useful information.

Individuals’ interviews are one of the most important tools in qualitative data collection and can be defined as an open talk between a field researcher and a person or group of people to discuss a set of questions related to a particular subject to obtain the data needed for the study, based on the knowledge of the participant or participants about the details of the subject under study.
Individuals’ interviews take between one hour to one hour and a half, and it can be done directly through a personal meeting between the field researcher and the participant, which is the most prevailing and appropriate form of conducting interviews, or by using modern means of communication such as Skype.
Advantages of individuals’ interviews:
Individuals’ interviews have many advantages, from which we can mention:
- Individuals interviews are considered suitable for collecting data on important and sensitive issues such as those related to family matters or violence against children.
- It is considered an opportunity for the field researcher to know the participant closely and help to obtain verbal answers and nonverbal indications that reinforce answers, such as expression changes on the participant’s face, his movements and emotional impressions, all that can be used in the data analyses process.
- Individuals interviews help to motivate the participant to answer questions, ensure a correct interpretation of the questions and allow the participant to inquire about any ambiguity about the questions asked, and therefore, answers are more accurate and the percentage of errors is lower.
- Individuals interviews are considered the best tools for data collection in illiterate communities, and in cases where the participant does not know how to read and write.
- When doing individuals interviews, the field researcher is able to ask new questions related to the topic in question-based on the answers of the participant, and these questions help him get what he thinks is useful data.
- Individuals’ interviews provide the field researcher with additional information about the subject in question and help him understand it well.
- Individual interviews provide a good amount of data, where the percentage of replies and answers is higher than answers in written forms.
- Individual interviews are considered the most appropriate way to collect data from important people, such as people with important positions in higher management.
- Individual interviews allow the field researcher to return to the participant to ask more questions or inquire about some of the answers.
A series of guides for the data collectors to increase their skills in data collection for various research sectors.
Titles of the guides:
- Data Collection ethics.
- Individual and KI interviews.
- Focus Group Discussion.
- Field visit/Observation.
The second guide is the individual interviews, This guide includes six main themes:
The advantages of individual interviews, the disadvantages of individual interviews, the types of individual interviews, the preparation of individual interviews, conducting the individual interviews, the common mistakes that field researchers make when conducting interviews

Various institutions and organizations in their endeavors in seeking flawless implementation of their services conduct extensive studies before implementing their projects to have a better assessment for the needs of beneficiaries, and to identify ways in which these needs can be effectively and efficiently addressed.
Conducting these studies requires the existence of a field staff which conducts periodic visits to the targeted group to collect data and submit it to the analysts that turn this data into clear results that reflect the situation of the target group. It should be noted that the credibility of the concluded results depends on the accuracy of the data obtained in the field.
Proper collection of data and its success in achieving its objectives require the field researcher to be equipped with many skills, such as strong observation skills, the ability to use and employ the different senses, the ability to communicate with the participants to build upon the information they give, and having experience in the use of various data collection tools.
However, having expertise and skill alone is not sufficient for a field researcher to ensure the success of the data collection process and to acquire accurate information, which in turn leads to reaching objective results that reflect the condition of the target group. In order to reach that, field researcher must adhere to moral and ethical data collection principles which are defined as a set of standards and behavioral rules that govern and regulate the work of the field researcher while conducting data collection process.
In this guide we will mention the most important standards and ethics that the field researcher must adhere to
A series of guides for the data collectors to increase their skills in data collection for various research sectors.
Titles of the guides:
1. Data Collection ethics.
2. Individual and KI interviews.
3. Focus Group Discussion.
4. Field visit/Observation.

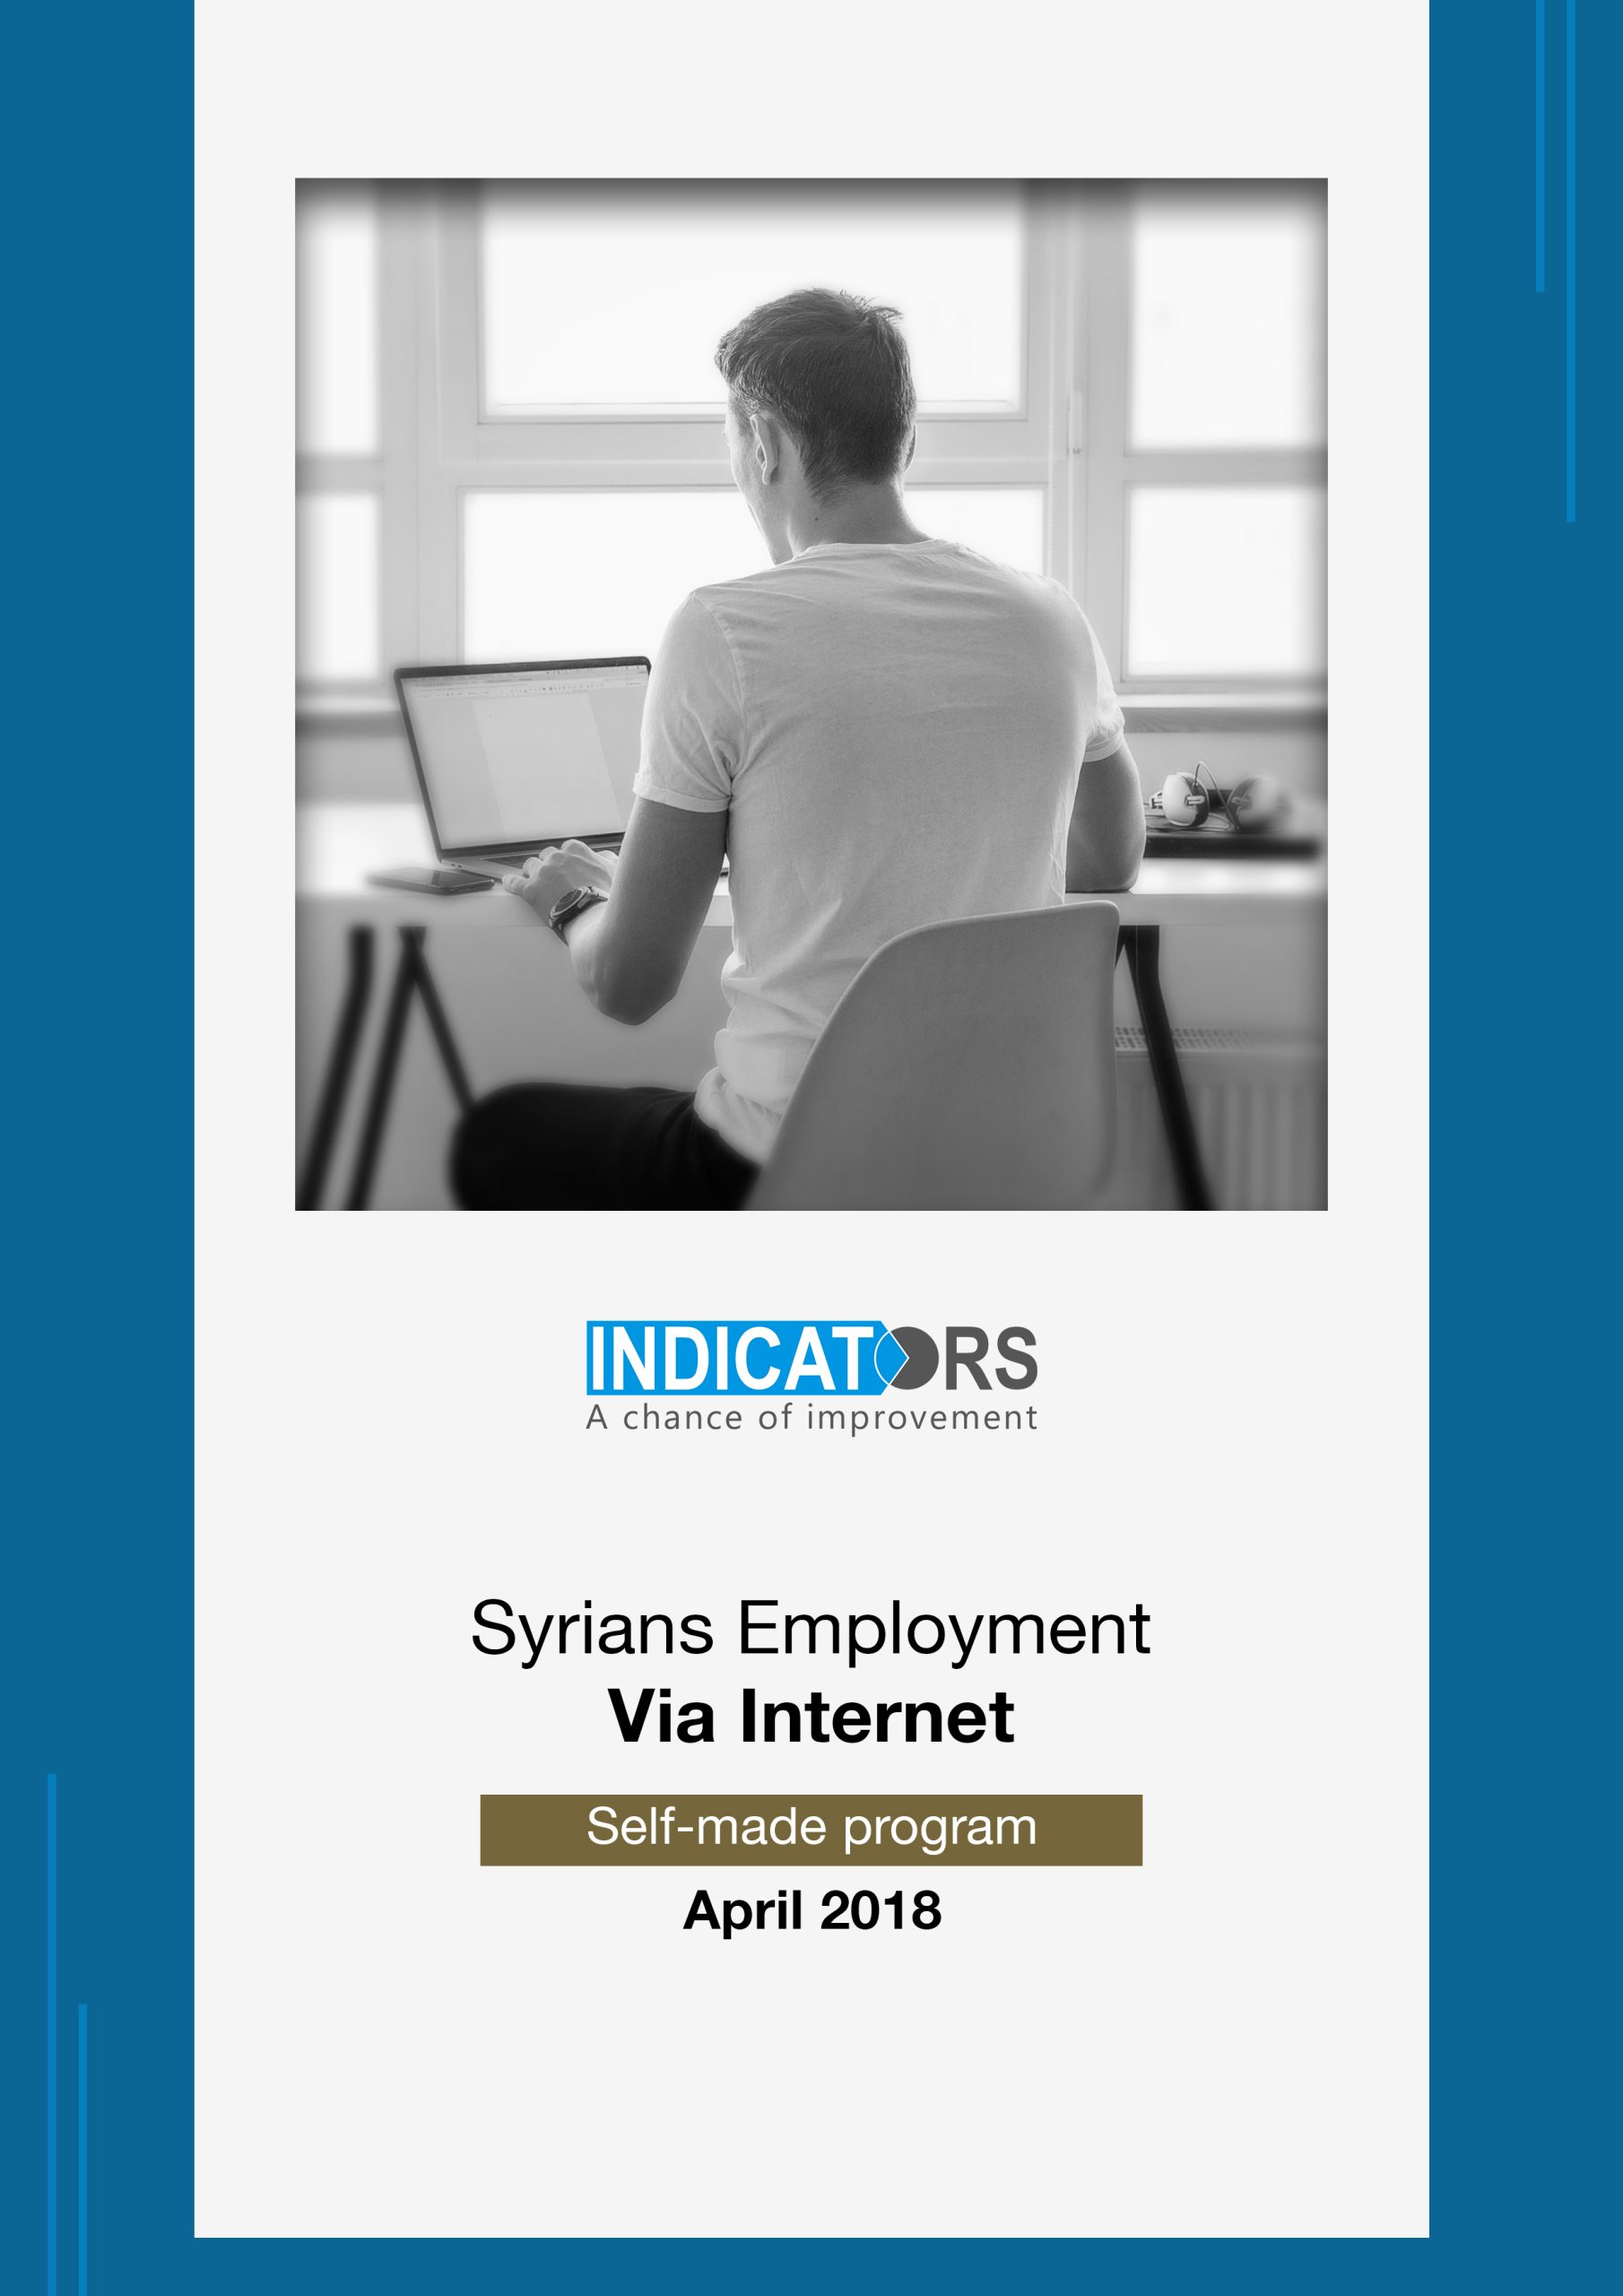
Online working doesn’t need the working to stay in the same place, which is make it suitable for Syrian situation, while Syrians can work wherever they move, they only need an internet connection and a computer to continue their work.
Another benefit comes from the income, which it will be in foreign currency, that means higher income comparing to the low prices of Syrian pound. This also brings money to the local market which increases its movement.
Brief of the assessment:
Objectives: This assessment is trying to increase the opportunities of Syrians online working, by screening the available competencies that suitable for such business, and discovering the projects that can be most effective and helpful for them to start working via internet, then share them with the NGOs that interested Syrian employment.
Main themes:
- Syrian competencies for online working.
- Description of the situation of current Syrian online workers.
- Barriers and challenges of online working, especially for Syrians.
- Expectations of growth for online working in Syria.
- Recommended projects to prepare Syrians for online working.
Scope:
The assessment will cover 3 governorates: Idleb, Daraa, and Aleppo.
Will be conducted in January/2018.
Target groups:
The questions concentrate on Syrian youth, females, and people with disability.
Data sources:
- Syrian individuals: to screen the competencies they have for online working, their awareness about it, and the equipment they have for such business.
- Syrian online workers: to provide full stories about some online workers, how they started their work, their monthly salaries, the challenges that face them, their needs to improve their business…
- Online working consultants: to have in depth information about online working, what they recommend for Syrian situation, what they recommend to deal with the challenges of Syrians online working, what kind of trainings Syrians need to be able to start working online…
- Secondary data: to review any research have been done about online working, what are the most demanded services, how online working platforms working, how to manage money transfers…