
Comparing SPSS vs Excel
Published on: 2022-04-25نُشِرَ بتاريخ: 2022-04-25
Data Analysis, Excel VS SPSS Statistics
An important question occurs to many of people interested in the field of data analysis or people who may need to use data analysis programs either for work or research; “What is the difference between Excel and SPSS? And when is each of them recommended?”.
In this article we provide a brief description of the advantages and disadvantages, this description is categorized according to the specialization or field of the required data analysis:
First: data analysis for academic research
We absolutely recommend using SPSS, as it offers very wide statistical analyses that has endless options. In this field, Excel cannot in any way provide what SPSS does.
For example, SPSS provides:
Parametric and non-parametric tests with wide options that include many tests required for researchers who are not specialized in statistics.
Regression and correlation analysis of its various types, linear and non-linear, with tests for them and analysis options that are widely related to them.
Time series analysis.
Questionnaire reliability tests.
Neural networks analysis.
Factorial analysis.
Survival analysis.
Statistical quality control analysis and charts.
Along with many other statistical analyses that serve academic fields.
Second: data analysis for non-academic research
It can be classified into several levels of data analysis:
Descriptive data analysis:
In general, the two programs are able to provide all the analyses required in descriptive statistical analysis, but Excel contains some minor flaws, such as that it does not arrange the answers according to their logical order, but rather in an alphabetical order, and it can’t provide calculations related to questions that include texts in addition to calculations related to their own order (Ordinal data) such as calculating the Likert Scale.
SPSS is characterized by providing tools for analyzing multi-select questions and with advanced options, which Excel does not provide, therefore, we need to use functions to get those analyses which options are limited with problems with the percentage that we get from it.
Disaggregation analysis:
It can be said that both programs are reliable in this aspect, except in the case of multiple and complex disaggregation/cross-tabulation with multi-select questions, in these cases, Excel becomes slower and less effective, while SPSS offers all options, no matter how complex they are, at the same speed required for descriptive statistical analysis and simple disaggregation. In addition to aforementioned, there are features such as filtering and data splitting features provided by SPSS, which accelerate data analysis to a very big scale, as it is possible to analyze the required data for 20 regions separately to be done at the same speed of analyzing data for one region, while in Excel, this means doing 20 times the work.
SPSS provides the features of descriptive analysis and data disaggregation much faster than we may think, as some analyses that take a week using Excel can be completed in just a few minutes using SPSS.
Third: Analyzing data of demographic indicators
When talking about demographic indicators, we find a challenge facing each of these two programs. In SPSS, we can perform numerous, complex and very fast arithmetic operations that outperform Excel, however, SPSS has some minor weaknesses that are important at the same time; among the most important matters that have been noticed in this regard is conducting multi-column conditional arithmetic operations, as SPSS provides multi-column arithmetic operations, but these operations do not contain multiple conditions, on the other hand, Excel provides this feature with a wide variety of conditional and effective functions.
Fourth: Data management and linking databases in the analysis
In this particular aspect, we find the clear distinction of Excel, as with the Power Query package, it offers features of data management, merging, and the possibility for aggregation and cleaning the data, in addition to the ability to link various databases without merging them, and analyzing them together with all types of analyses.
As for SPSS program, it does not include the feature of analyzing isolated databases without the need to merge them, on the other hand, it can solve a large part of this problem by merging databases, but this entails many challenges and great possibilities for error. When merging more than one database, there is usually a repetition of cases to match the other database, and this means that when we analyze the database that has been duplicated, we must perform operations that cancel this repetition in order to obtain correct analyses.
The features of data management and analyzing isolated databases together is considered as a great advantage of Excel, but in most cases it is not required, as it is only needed in complex and advanced projects.
On the other hand, SPSS program in the Data menu provides many features that can only be described as great, and the lines of this article are insufficient to talk about them, but they can be briefly described by saying that they gives data management some features that can outperform Excel in some aspects, such as the Unpivot or Restructure features that SPSS provides including features that are far more advanced and powerful than Excel.
Fifth: Weighting
One of the very important aspects of data analysis, especially with regard to demographic statistics, humanitarian needs analysis and advanced market research, is the Weighting feature, which helps to calculate the data after taking into account a weight that expresses, for example, the population of the governorate or the studied area, which gives it an amount of needs that is commensurate with its size.
This feature is not provided by Excel, if we wanted to calculate the weights manually using functions in it, this sometimes causes problems in the results, especially in the disaggregation analyses.
In SPSS, once you choose the option of Calculating Weights, it will be automatically applied to all calculations whatever they are, even on charts, and we can stop calculating weights with only one click.
This is a simple comparison between the two programs, we hope this comparison gives a preliminary perspective and help data analysis specialists and institutions that need to build the capacities of their team in this field to choose the most suitable program for them.
By:
Ghaith Albahr: CEO of INDICATORS

Customer experience testing
Published on: 2022-03-05نُشِرَ بتاريخ: 2022-03-05
It is the impression you leave on your customer at every stage of his journey to purchase a product or service, which leads him to think of your brand and promote it among his acquaintances and friends.
The difference between customer experience and customer service:
Customer Service
It consists of interactions with the customer in order to obtain the offered product or service, giving the customer the information he wants to know, and receiving complaints and inquiries.
Customer Experience
It can be simply explained as accompanying the customer from the beginning to the end of the journey, i.e. the purchase of the product and the impressions it provides at each stage of his communication with the company and the impressions about the product or service after purchase.
Customer service can be considered as part of the customer experience, as they are strongly related, but there is a difference between them.
To simplify the Customer Experience term, the following example can be used:
Suppose we have a movie, to produce this movie, we need:
1. Director – Executive Director – Sound Director – Cameraman – Producer… (Management Team).
2. The actors and all the individuals who appear in front of the camera.. (Employees who are in direct contact with clients).
3. The script, the dialogue, and the area in which the movie is filmed … (the tools used to produce the product or service offered by the company).
4. Current viewers..(existing clients and potential clients).
We have a highly professional script, dialogue, venue, director, lighting and sound engineer, and cameraman, but the experience of the actors is low, or we could say that it is not good, will the viewers get the aim or the moral of the movie? (Of course not) and this is the biggest mistake that current companies and institutions make with regard to the customer experience, as they focus on the management team so that they have high expertise to produce the product or service and do not care about the employees who are in direct contact with the customer who is the face of the work, the thing that negatively affect the company’s reputation, and may lead to the loss of existing customers and failure to get new ones.
The Importance Of Customer Experience
It is very important for the continuous growth of a business, as ensuring a positive customer experience contributes to:
• Building brand loyalty among customers.
• Activating your product or service and embed it in the minds of customers.
• Creating marketing opportunities by customers themselves, by writing positive comments and impressions that are more important than paid advertisements and promotions, and more influential on other customers.
On the other hand, customers want to feel connected to their favorite brand and want to feel that it knows them, respects them and cares about them. For example, suppose there are two cafes that are close to each other, and they have the same brand of coffee and the same qualities, but one of them is more expensive than the other, and the most expensive pays attention to its customers and their details, for example: He says to his customers: (Your usual drink?) which leads customers to go to the most expensive, because it satisfies the customer’s needs of drinking coffee with a feeling of care and good treatment.
Customer Experience Methodology
1. Developing customer journey map
A customer journey map is defined as a story supported by a map that includes all the interactions and communications that the customer has with the company in order to obtain a particular product or service.
Whereas a map is drawn for all potential customer paths during his journey in order to obtain a product or service and identify all channels and interactions that the customer can make at each stage of the map.
2. Evaluating the integration of operations in companies
Evaluating each of the stages that the customer goes through in order to obtain a specific product or service in terms of customer satisfaction and whether it is integrated or not, this is done through studying the customer’s experience in each of the operations in detail.
3. CRM Evaluation
It is done through an assessment of the company’s interaction with current and future customers, where customer data with the company is analyzed in order to get the best path of customer relations, with a focus on retaining old customers.
4. Experimental implementation of customer experience
It is one of the most important stages of studying customer satisfaction or customer experience, and it is done through conducting an experimental implementation of a customer journey after developing the previous tools, and accompanying the customer from the stage of purchasing the product until reaching the post-purchase stage, to get the feedback of the customer about the product, and knowing all stages and paths he went through during his journey with the company.
5. Analyzing Customer Satisfaction
This stage begins after the customer purchases the product or service and gives feedback on his journey with the company and the product or service, whereas the customer’s opinions and feedback are analyzed to reach the problems that the customer may face, and the positive and negative things that he can see in the product, then the necessary measures are taken to address these matters.
6. Studying the customer’s perception about the company
This is done by conducting a short questionnaire for the customer, in which he is asked about all of the stages of his journey, the nature of the relationship at each stage, and his views on how to make the service or journey better, and then analyzing the data coming from the customers to obtain comprehensive and general perceptions to improve the stages of the customer’s journey.
Example of customers’ journey:
For example, what does Google say about its customer experience testing?
If users can’t spell, it’s our problem
If they don’t know how to form the query, it’s our problem
If they don’t know what words to use, it’s our problem
If they can’t speak the language, it’s our problem
If there’s not enough content on the web, it’s our problem
If the web is too slow, it’s our problem
The purpose of customer experience testing is to be concerned with customer needs rather than the amount of sales.
The focus must change from absolutely focusing on the product to focusing on the customer experience to Improve the product based on results, and from being concerned about the broad market to being concerned about the individuals who connect you to the broad market.
By:
Ghaith Albahr: CEO of INDICATORS
Anas Attar Sabbagh: Research officer in INDICATORS

Dell’s success story
Published on: 2020-04-10نُشِرَ بتاريخ: 2020-04-10
By:
Reem Barakat
From its beginnings Dell company worked as a leader in the “build-to-order” approach, providing individual computers that were made to the customer’s request, and according to the Neronet-academy website the beginning of the company was from the apartment of a college student named “Dell” and His first clients were on a low income so he started to collect computers By himself and sell it to his customers directly.
In 1985, Dell sold the first computer designed by his company from the Turbo PC, and participated in many exhibitions to show his strength in the competition, and one of the things that made his product unique is the design of a computer with good specifications and a competitive price for a wide range of customers, and that was the result of his constant proximity to His clients, which enabled him to know their needs. Over time, Dell outperformed many competitors, and in the 1990s it ranked fourth in the first 10 companies that won customer confidence, both Security and technical.
One of the most important elements of the company’s success was its constant focus on research and development and market research, so it owned an analysis department that oversaw pricing, web analytics, and supply chain analytics, and also hired researchers in customer service, It has built tools and system to study customer satisfaction and obtain feedback, as well as a prompt and accurate complaints response system, By exploiting the development of the Internet and the emergence of social media, it was able to study customer satisfaction more accurately and respond to all customer complaints, no matter how many, which increased consumer confidence in the company and its products In addition to its reversal of complaints and feedback analyzes on developing its products and improving its quality, this increased its success, market share and ability to compete, which reflected on increasing its profits significantly and making it maintain its name as one of the world’s largest companies in the computer industry.

INVESTMENT STUDIES BENEFITS AND MOST IMPORTANT TOOLS
Published on: 2020-04-08نُشِرَ بتاريخ: 2020-04-08
How to establish a successful business?
By:
Reem Barakat & Ghaith Albahr
What are the reasons for the failure of startups?
Have you ever wondered why most businesses fail in the first years of their establishment?
Do you know what are the most important reasons for the failure of these businesses? Did you know the relevance of that to market research? Do you know what is the investment research and
what it’s role in ensuring the success of startups?
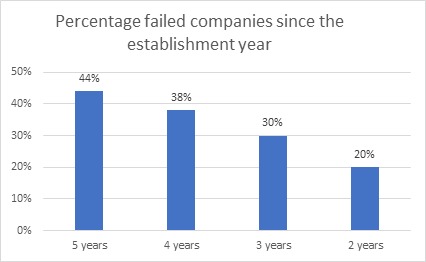
According to Small Business Trends site only 56% of companies reach the fifth year since their establishment, the most important reason for the failure of companies is the lack of need for the services they provide or wrong in the way the service is offered Which represented 42% of the reasons of companies failure, as for the rest of reasons, they were related to wrong pricing, as the price of the product was not estimated compared to competing products and the added value that it provides, releasing the product in the market in a wrong way, the wrong design of the product because it was user un-friendly, and customers’ feedback has not been followed up and product development not followed so that it overrides its issues.
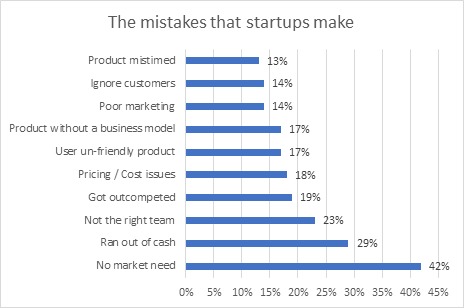
The previous research and many other researches about the reasons of failure of startups and entrepreneurs also indicate that customers have not been studied by the company’s founders, and lack of information about competitors and competing products , in addition to absence of product development in a way that can gain customer satisfaction and achieve competitiveness in the market, they are the main reasons why companies are gradually fail until they reach the stage of collapse and closure.
An example of that was EXEC company, according to Startup Graveyard website EXEC provided cleaning services requested online but the company has suffered from many problems and closed by its founders after facing huge loss due to lack of experience in the field, In addition to the obstacles of getting customers because of the lack of design service that meet their needs, this resulted in the company diversifying its services, where quality has not been concentrated in one service and waste their efforts in several services and what made the problem bigger was the neglecting Follow up of customer satisfaction and feedback, so the company did not notice its mistakes in time.
What is the relationship between the investment research and the feasibility study?
Most companies carry out brief feasibility studies focusing only on financial and technical details, and don’t focus on product design, customer behavior analysis, and study the competitors in the market, this is because some countries do not grant licenses to the companies without conducting feasibility study and that what make it a formal procedure to fulfill the governmental conditions which makes companies fall into a lot of issues because the feasibility study is not correct and most of these issues result from leniency in things that could be more than important to the company’s success. One of the mistakes that companies make is underestimating the importance of investment research which can reduce the waste of the seed capital and guarantee the achievement of revenue that help the company survive and guarantee its market share. Moreover, the important role that investment research plays is increasing the accuracy of the feasibility study by providing information about the customer behavior and the competitor that affects in expecting the costs, revenue and financial analysis, in addition to marketing plan and activities, Thus it can be said that the establishment of a company without relying on studying the market is one of the biggest reasons for its failure.
What are the steps to implement the investment research?
An investment research can be defined as one of the methodologies of market researches, it is devoted to being a market research for the establishment of the company and considered as a provider of information that required to complete the feasibility study, to obtain an effective investment research, It should be implemented in four steps:
1-Idea Validation:
which comes in the first steps of the investment research in order to test the correctness of the idea of the business that we want to establish. The idea validation contains three sections which is the availability of internal capabilities for project success, this means the seed capital, the expertise that can increase the business’s chances of success, and the expertise required to complete business requirements and the possibility of finding them. this is followed by testing the market environment related to business field, the most important thing that related to that is the competition environment and suppliers, customers, and the ability to enter new competitors. In the end comes the evaluation of the economic environment in the country, such as labor regulations, economic stability, available technology, energy and everything related to environmental affairs affected by this type of work.
2-White Paper:
before starting the detailed market research, many questions must be answered that helps in define the company’s scope of work and market research, including: does the company have to sell in the local market or export other countries? Which countries it have opportunity in? or which local territories? Which customer segments are recommended to target? What are product attributes that make it competitive (in terms of quality, product shape and size…)? What are the products that are in high demand recently?. Usually the data of the white paper data are collected from secondary data (Previous researches, government and customs sources), it collects information about the last three years. It can be said that the goal of the white paper is to search for any gaps in the market and use them as a market entry from which the company can benefit in order to competition and acquisition of its market share.
3-Market Research:
its main goal is to provide all the information that necessary to build the feasibility study and to establish a company in the right way. One of the most important information that provides is product description and the best way to release it to suit the needs of the market and the customers, or if it is a service, it should be designed in a way that meets the customer’s need as well as studying the competitiveness in market and all the details of competing products or services and alternative products, in addition to information regarding the appropriate marketing ways and sales channels, furthermore all information related to the legal conditions for establishing the company, and all the costs required for financial analysis in the feasibility study. The information provided by the market research should be as detailed as possible because any neglect of important details may be reflected for example on a product’s failure to compete, or on costs that were not taken into account. The market research is usually based on primary data that are collected directly through interviews with potential customers and consulting experts…
4-Feasibility Study:
The feasibility study covers four main topics: legal study, technical study, marketing study and financial study.
What should I keep in mind when implement an investment research?
It is necessary to pay attention to the fact that the investment research is a cumulative process, so it doesn’t take place once and ends, as we have noted in the steps of the investment research as a sequential process that helps build accumulated knowledge on how to ensure the success of our business, in addition to this, the importance of having flexibility in work during the establishment stage, including that the results of the investment research are not considered conclusive, are rather tested and modified according to the results that we obtain during the testing process. In other words, to ensure the success of the business and the investment research, it is advised to continue during the first years of the life of the company, especially in the first two years, that the products and services of the company be released in the market within limited segments of the customers and read the reactions and feedback, in addition to searching for issues that customers suffer from and turning them into opportunities by developing products to solve these issues, and trying to discover customers problems with competitors to try to take advantage of them to increase the market share of the company . All these details mean that we should not limit the investment research to the stage before the company launching, but rather we must continue to read the market and develop the business model.
Sources:

Issues of Asking Direct Questions
Published on: 2022-05-24نُشِرَ بتاريخ: 2022-05-24
Researchers and workers of all research fields (monitoring and evaluation, market research, opinion polls… etc.) usually work on identifying a set of research topics (usually called either research topics, key questions, or hypotheses…), then derive the questions that will be asked in the research tools from these topics. The problem I noticed that many researchers have, especially those working on developing #questionnaires / #research_tools, is that the phrasing of the questions uses almost the same words as the research topics. i.e., If we had a question about “the needs that would help increase the level of inclusion of people with disabilities in education”, the researcher asked people with disabilities “What are the needs that would help increase the level of your inclusion in education?”.
This method of phrasing results in many problems that would lead to not obtaining correct results or to a failure in answering the questions of the research, and this happens because:
1. The research topic may include terms that the participants are not familiar with, as academic terms are often used in research topics, therefore, other equivalent words that are used in real life must be used.
2. Most of the main research topics are complicated which cannot be answered by answering a single question, rather, they should be partitioned into sub-topics. Those sub-topics shall be phrased into questions (taking into consideration the appropriate amendment of the phrasing also), therefore, presenting the research topic directly and literally will cause confusion for the respondents, as they will be facing a broad and general question that is difficult for them to answer in this way.
3. In most cases, the participants do not have a level of knowledge that would help them answer the question in this form, this means that when studying the needs of people with disabilities that are required to increase their inclusion in education, it is better to ask the questions that related to the problems and difficulties they face that hinder their access to an appropriate education, with the necessity of emphasizing that asking about these problems and difficulties must be in a detailed way.
In summary, it can be said that the process of developing questionnaires appears to be easy for workers in this field, especially non-specialists, and anyone can work on the development of the questionnaires, but the experience, especially at the time of receiving data after all the efforts exerted for structuring the sample, and research methodology, shows that the data are useless, and this is due to the wrong design of the questionnaires.
Questionnaires can be expressed as the clearest example of the phrase “deceptively simple”, as anyone can develop a questionnaire, but the challenge comes with the obtained data. I recommend all workers in the field of research to improve their skills in #questionnaire_writing, and concentrate on the applied references, as most of the books only tackle theoretical aspects.
By:
Ghaith Albahr: CEO of INDICATORS

Issues of Dealing with Missing Values
Published on: 2022-05-20نُشِرَ بتاريخ: 2022-05-20
A lot of data analysis programs do not have the ability to distinguish between many values, namely:
· Missing Values
· Blanks
· Zero
This weakness of data analysis programs also extends to the failure of many data analysts to distinguish between these values, therefore, these values are not being distinguished or dealt with, and data are not being analyzed based on these differences.
Some may think that these differences are not very important, and they ignore them and leave dealing with them to data analysis programs, but in most cases, this gives catastrophic results that many people do not realize.
I will attempt to illustrate these differences through some examples:
1. If we want to analyze the average income of households in a country suffering from a crisis, it was noticed that a high percentage of respondents said that they have no income of any kind, and the percentage of these respondents is over 40% of the surveyed families. Data analysts dealt with these cases as missing values, the thing that gave results that are utterly different from the situation of society, as the socio-economic indicators in this case will show, for example, that only 10% of HHs are below the extreme poverty line, but the truth is that the percentage is more than 50%, because whoever does not have any income must be considered as his income is zero rather than a missing value, because the missing value is not included in the calculations, while the value zero is, and thus affects the percentages and the general average of income. In the opposite case, in the event of asking about the monthly salary, the salary of a person who does not have a job will be considered as a missing value rather than a zero, as he is unemployed and the salary is not calculated as a zero.
2. Many programs do not consider the blanks in the text questions as a missing value. For example, we find that the SPSS program does not consider the empty cell in the text questions as a missing value, but rather considers it a valid value, as in the Gender column, if it is a text question, the program will calculate the empty values, the thing that significantly affects results such as percentages, knowing that those who did not indicate their gender (male or female) should be considered a missing value.
3. In the SPSS, when trying to calculate a new data column from other columns, we find that some of the codes (formulas) can deal with the missing values effectively and some formulas cannot, for example when trying to calculate the total number of the family members out of the family members of each group, and we used the (sum) formula. We notice that SPSS gives the sum result even if there is a missing value in one of the categories, while calculating as a manual sum will give the sum result as a missing value when any of the cases with a missing value is encountered.
The cases in which there are issues in defining the missing values are unlimited, and I do not advise in any case to give the data analysis program nor the data analyst alone the freedom to guess and deal with those values, as the appropriate treatment and definition of the empty value must be determined, as we explained in the income case, the missing value must be considered as zero, while in the salary case, it must be considered a missing value, and in our third example, the empty cells of any category of family members must be considered zero, knowing that from the beginning, data collectors must be told that if a family does not have any member of a certain category, they must not leave a missing value, rather, they should fill it with a zero.
By:
Ghaith Albahr: CEO of INDICATORS

Ordinal Questions , Challenges and Issues
Published on: 2022-05-23نُشِرَ بتاريخ: 2022-05-23
The ordinal questions, where the participant is asked to answer several options in order of priority contain many issues.
I will talk through my observation of many cases about these questions focusing on the negatives points:
1. The process of arranging options according to the most important and less important is a cumbersome and time-consuming process, so it is noted that most participants do not answer them seriously, and therefore the order obtained is inaccurate.
2. In the questions in which we choose the most three important answers in an orderly way, the order tends to follow the order of the same answers in the design of the questionnaire, meaning that the participants tend to choose the answers that are mentioned to them at the beginning as the most important.
3. A big problem with the analysis of the ordinal questions is due to the weakness of most statistical programs, and the lack of ready-made analytical methods for these questions, so the data analyst is forced to do manual calculations, which causes issues in the analysis.
4. A problem in the outputs of the analysis: -Calculating the order as weights will give a result that may exceed the real value, meaning that the numerical result that we will get does not express a real value, but rather expresses the weight and importance of this option compared to the other options and not the percentage of those who chose it.
-Many data analysts have difficulty dealing with these questions, so they tend to use inappropriate methods such as displaying the analysis of the first priority only, displaying the analysis of each priority separately, or analyzing the question as a usual multi-select question.
-An error in calculating weights, the weighting system in statistics is not arbitrary, that is, in cases, it is considered in the form of degrees 1, 2, 3, or in the form of probabilities or percentages of the original answers…etc.
-An error in defining the weights of the answers, as the first priority should take the number 3 and the third should take the number 1, knowing that the logical order is the opposite, but as a final value it must give a higher number to the first priority, and this is usually the mistake that some data analysts made.
5. Issues with the report writers where some of them are confused about how to present and discuss the results in the report correctly.
6. Problems in the disaggregation of ordinal questions with other questions, as the question exists in several columns in the database, in addition to the need to take into account the weights, and to the disaggregation with one or more questions, which leads to many data analysts to make mistakes in analyzing these questions
By:
Ghaith Albahr: CEO of INDICATORS

Outliers Processing
Published on: 2022-05-20نُشِرَ بتاريخ: 2022-05-20
Some data analysts do not grant any attention to outliers, and they may have first heard this term while reading this article. Outliers have a significant impact on many statistical indicators, and the methods of handling and processing them are related to many factors, some of which are simple, and some are more complex and related to the type of statistical indicator, as the data analyst must know the classification of the Smooth Parameters and the that’s not, and this indicates the degree to which it is affected by the outliers.
For example, the mean is considered one of the best indicators/coefficients of central tendency, but it is extremely affectable by outliers compared to the median, knowing that the median is not considered an accurate coefficient compared to the mean.
Within the following lines, I will try to tackle an important aspect related to the outliers, which is the simplest, it’s the methods of processing outliers:
Methods of processing outliers:
1. Revision of the source: we revise the source in order to check the value, if there is an entry mistake, it is corrected, such as writing the age for a study about children as 22 by mistake instead of 2, so, we simply discover that it is an entry mistake and correct it.
2. Logical processing of outliers: Mistakes of outliers can be discovered through logical processing, simply, when studying the labor force, for example, the data of a person who is 7 years old are deleted because he is not classified as a labor force.
3. Distinguishing between what to keep and what to delete: This process is considered very exhausting, as there are no precise criteria for accepting or rejecting outliers. In this regard, SPSS program offers a useful feature, which is classifying outliers into two types, Outliers (which are between the first/third quartile and one and a half of the inter-quartile range), and Extreme values (which are between one and a half to three times the inter-quartile range), in other words, data far from the center of the data and data extremely far from it, in this case this classification can be adopted by accepting outliers and deleting extreme values.
4. Replacing the outliers that have been deleted: The last and most sensitive step is the decision to deal with the deleted outliers, whether to keep them deleted (as missing values) or replace them, the challenge begins with the decision to replace them, as leaving them as missing values entails consequences and challenges, similarly, replacing them also entails consequences and challenges. The decision of replacing deleted outliers is followed by the appropriate methodology for replacement, as the process of replacing missing values is also complicated and has various methodologies and options, each of these methodologies will have an impact in a way on the results of data analysis (I will talk about replacing missing values in another post).
It is not simple to summarize the methodologies for dealing with outliers within these few lines, as deleting outliers puts us in front of other options; shall we leave it as a missing value or replace it with alternative values? Also, when we delete outliers and reanalyze the data, we will find that new outliers have appeared, these values were not considered outliers considering the database before it was modified (before deleting the outliers in the first stage), therefore, I recommend Data Analysts to study more about this topic, considering the extent of studying they need based on the volume and sensitivity of the data.
By:
Ghaith AlBahr (Mustafa Deniz): CEO of INDICATORS

PESTEL tool
Published on: 2020-04-21نُشِرَ بتاريخ: 2020-04-21
By:
Ghaith Albahr: CEO of INDICATORS Company
Reem Barakat: Research Coordinator in INDICATORS
What are the external factors that affect the success or the failure of startups?
Business sector is a very complex, anything happens in the country affects it, directly or indirectly as well as the internal factors that affect companies such as the employees and the required logistics, and the external factors such as competitors, customers, and suppliers…etc, there are bigger and more dangerous factors, if not taken into account, these factors are generally centered around the surrounding regional environment such as the economic downturn, the changing climate of some countries, the political circumstances, society targeted by the company, and several other factors that must be taken into consideration.
When proposing a new project idea it cannot be adopted only because it is unique, for example according to Wikipedia KitKat company offered 300 different flavors of chocolate bars in Japan since 2000 to test and release new products in Japanese market, taking advantage of the low of fees on primary products, this helped in the company success and achieve more sales in Japan from 2012 to 2014, due to the fact that generally known about Japanese people love green tea, this made KitKat launch a chocolate bar with green tea flavor in 2004, even it changed the cover of this chocolate to green color, while it is in all other countries where offered in red cover, KitKat depended on the research of society norms and traditions, that why it went to this big change in Japan and which was one of the most important factors that helped the company make huge profit.
As well as the example of KitKat, many companies try to enter the market without taking into account these external and regional factors which caused its failure.
What are the external and regional factors that must be considered for your new business?
As we’ve see in KitKat example it is necessary to pay attention of many regional factors, in order to test these factors correctly without neglecting any of sensitive aspects it’s recommended to use PESTEL tool which is considered one of the idea validation tools, this tool helps to know the circumstances and the general factors that surrounding the company and their impact on it. PESTEL focuses on six main factors that neglecting them may cause the company failure or loss of money and time, for example, if we are seeking to establish a construction company that costs millions of dollars which will be in a country where the market in need of the services of such company, but in terms of political and economic conditions, it has been found that the continuous depreciation of the currency of the country has a high likelihood to cause the company failure, if several million dollars are invested in the company and the money transferred to the local currency and the value of currency decreased to the half over three years this means that if the company gain 100% profit actually it will just be reached to zero point comparing to the value of the capital in dollars.
In order to have integrated analysis of the regional factors affecting the company, PESTEL tool focuses on the following six factors:
-
POLITICAL: which means studying the country political stability in its relations with neighboring countries and other countries, and how that affects the company we want to establish, such as political boycotts that occur between countries that negatively affect import and export, and tax policy that the state provides for foreign companies or goods imported from certain countries, I.e. the economic war launched by America against China, in this period it’s not recommended for a US company to start a business that highly dependent on Chinese electronic parts because double the taxes will cause the business failure because of the high prices of their products, which leads to their inability to compete.
-
ECONOMIC: Which means knowing whether the country is in economic recession or growth, the stability of the local currency, what is the situation of country credit rating, the extent of confidence in the products it exports, and everything related to the economic aspects of the country with focusing especially on the factors that affect our company, in the example that we’ve mentioned before, we’ve seen how the decrease in the value of the currency cause the company to lose all of the profit despite the fact that all indicators related to the demand for the construction services were positive.
-
SOCIAL: all about social customs and traditions, the composition of the society, religions and intellectual currents…etc. Let’s say that the company works in Middle East in the field of food products, when trying to enter the Japanese market, it launched products similar to the ones it offers in the Middle East market and faced low sales and huge losses even though the same products were successful in the Middle East, so when returning to the reasons it found that the company was offering products of family sizes which is too big for the Japanese family, while in the Middle East the family consists of an average of six, while the Japanese family consists of a maximum of three.
-
TECHNOLOGICAL: It is all related to the technological infrastructure in the country that affects our business which its negligence could be the reason for its failure, especially if it depends in a large part of its work on that. I.e. before YouTube, several companies tried to launch sites of video watching but they failed because the Internet was at that time still on Dial-Up system which did not help to attract people to watch videos because it takes too long to be loaded, as for YouTube succeed because it was established with the beginning of the DSL internet, which was the most important factor for its success.
-
ENVIRONMENTAL: everything related to the environmental conditions in the country, regulations related to the environment and environmental licenses, which have a direct impact on the company in this aspect. I.e. it was noticed that many investors who moved from countries that did not require complex environmental licenses and established factories in other countries immediately started planning for work with maximum capacity and built financial plans on their expectations to start production directly they were shocked that these countries did not allow them to operate except for a limited capacity for factory waste and exhaust tests to obtain the environmental licenses and operate the factory with full capacity, some factories required at least six months to obtain the environmental licenses and that led to huge losses that started from contracts that were concluded with customers and were not fulfilled and employment of workers that should work with full capacity, in addition to mistakes in the financial calculations.
-
LEGAL: it means the regulations stipulated by the state related to employment regulations, consumer protection, ownership, health, education and the conditions that the state sets in general for the establishment of any company, neglecting the regulations will cause the company’s failure as if the company establishes the project without paying attention to the legal conditions related to employment and calculates the cost of the product and the pricing neglecting the costs related to employment, which leads to mistakes in pricing and the company’s loss.
How do I make the best use of PESTEL?
Mostly, PESTEL analysis implemented through workshops in which investors and people who participate in the establishment of the company, in addition to experts and specialists in several fields, the most important of which is the company’s field of work itself and specialists in economics and law, and the other fields that related to PESTEL analysis. The depth of the analysis, discussions and the number of workshops that needed depend on the business size and complexity.
To benefit more from PESTEL analysis, it is recommended to look at the risks that this analysis reveals as opportunities, as it can be turned into opportunities by building procedures or bringing about changes in the project idea so that it is able to deal with those risks or use them as a market entry. In other words, if it shows from the results of PESTEL analysis that there is a big risk that the company may face in an aspect it is not necessary to consider the business idea a failure or cancel it, but rather to think about how to develop the business idea in order to exceed this risk, make it as a competitive advantage and increase the opportunities of the success of our business.

PRODUCT DEVELOPMENT
Published on: 2021-10-28نُشِرَ بتاريخ: 2021-10-28
By:
Ghaith Albahr: CEO of INDICATORS
Anas Attar Sabbagh: Research officer in INDICATORS
Product Development Strategies:
Product development strategy refers to the methods and procedures used to present new products to the market or to modify existing products to create new businesses.
Product Development Stages:
1. Identifying opportunities (the emptiness that the product will fill)
2. The stage of creating new ideas
3. Idea’s assessment stage
4. Studying the new product in terms of cost and quality
5. Testing the developed product
6. The stage of introducing the developed product to the market
7. Post-marketing evaluation stage
The Importance of Product Development
Product development is one of the important marketing activities during the life cycle of the product and the activity of the establishment as a whole, as this process represents the stage of innovating, creating, and presenting all that is new, on the basis that the consumer expects the establishment to provide him with the best in terms of quality and efficacy at the convenient price and at the convenient time and place.
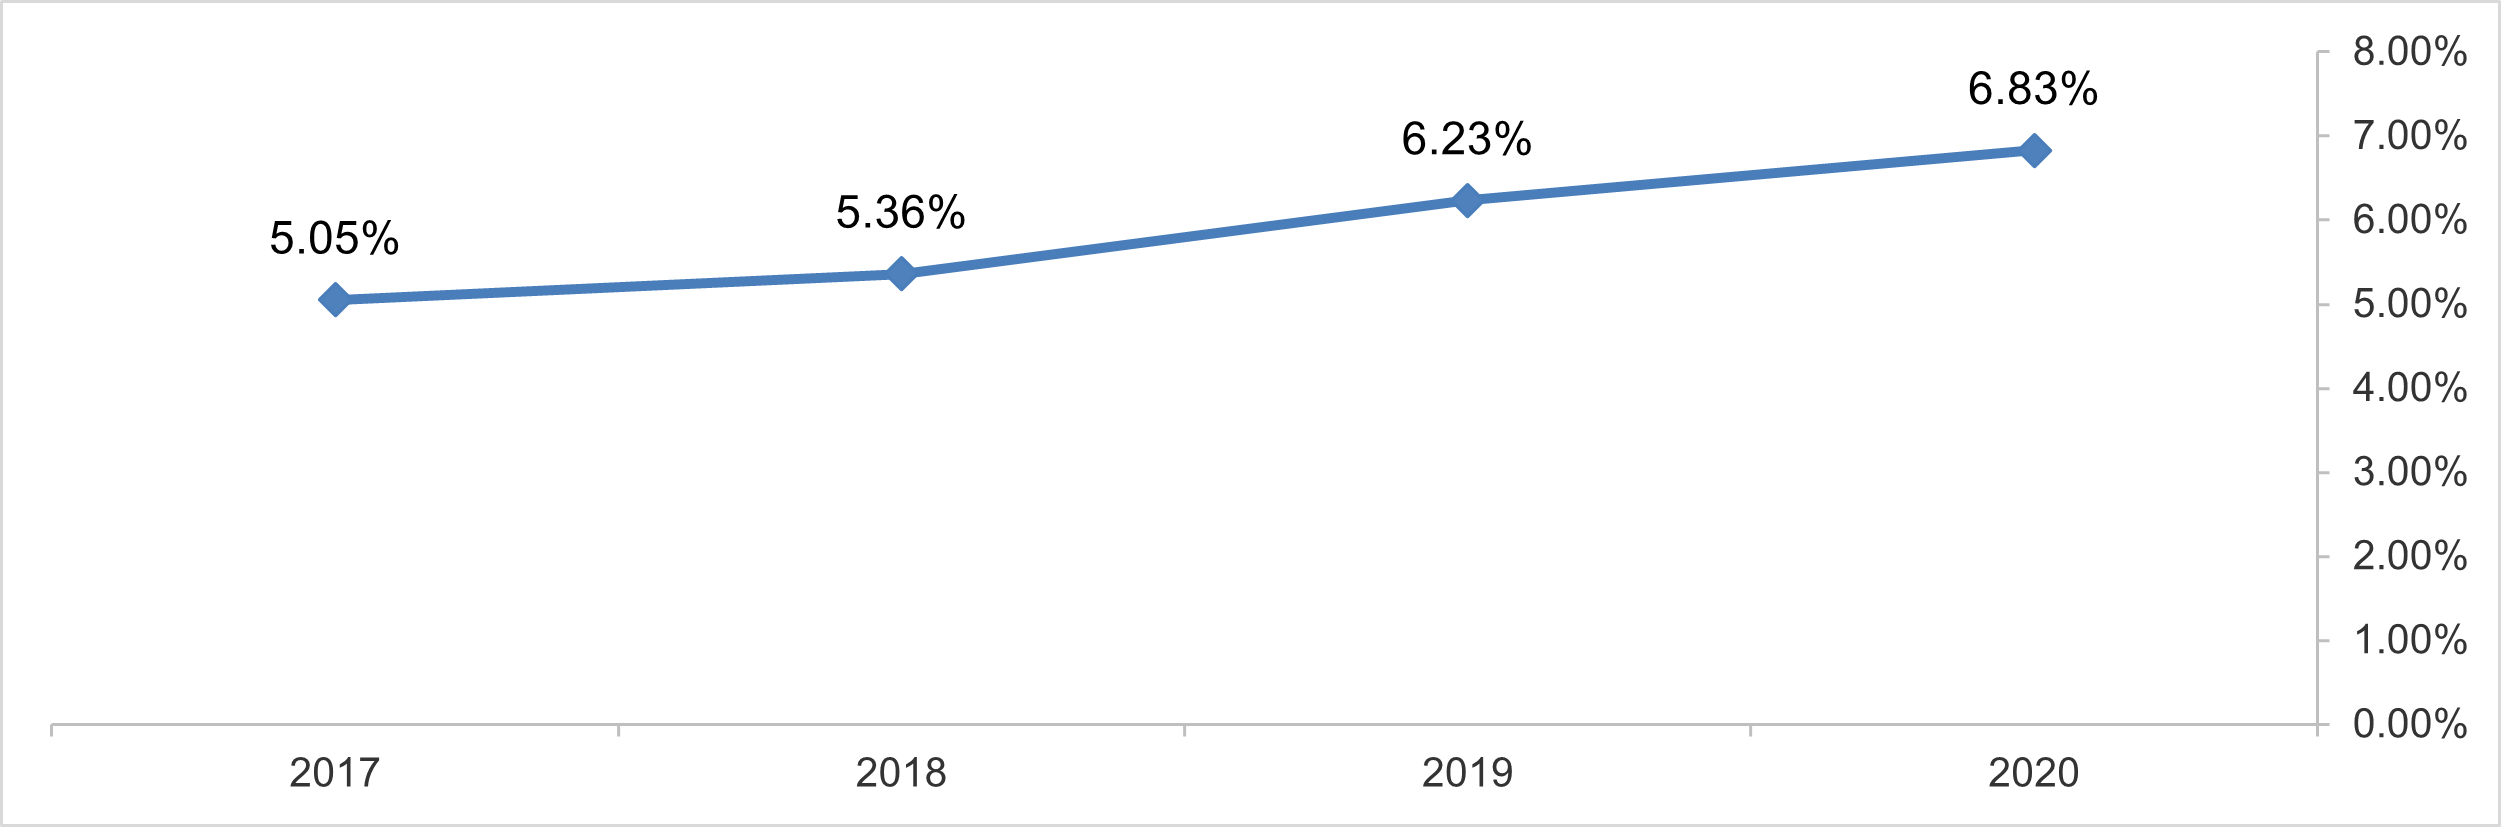
The following chart shows the percentage of the expenditures spent by (APPLE)
Co. on research and development in relation to the total revenues
Product Development Data Sources
1. Customer needs analysis
2. Customer behavior analysis
3. Competitor analysis
4. Customer feedback analysis
5. Studying customer satisfaction
6. Testing customer experience
7. Compared to other experiences
8. Analyzing competitor products and alternative products
Product Development tools
1. Innovation
2. The new product must be eco-friendly
3. Manufacturability
4. Improving maintainability
5. Reducing complexity and increasing modularity
6. Increasing efficacy and durability
7. Reducing production costs
Product Development Risks
1. Takes a long time
2. The product development process is expensive
3. Strict legal requirements
4. Failure in estimating results

Rubbish data
Published on: 2022-05-23نُشِرَ بتاريخ: 2022-05-23
Through my experience of working with many organizations, research centers, and academic researchers, I have noticed an issue in the collected data that only can be named as rubbish data or useless data.
The idea of useless data can be summarized as data or questions asked in questionnaires that are not useful in anything related to the objectives of the research, for example in many monitoring or evaluation activities, questions are asked in beneficiary interviews about the family structure in detail, such as asking about the family members disaggregated by gender and age groups. Some may think that these data are important, but experience says the opposite, as these data are important in the phase of needs assessment and selection of beneficiaries, which were already collected in the previous activities, and all the cases I witnessed did not use this data (in the course of writing a monitoring or evaluation report), and in the best case, the family members data were grouped into a final number, so why were all these details asked and make the beneficiaries exhausted with all these questions?
The belief of some researchers that if these data are not useful, it will not cause any issues is wrong, as a large number of questions and asking questions that have nothing to do with the research objectives causes several problems, including an increase in costs, an increase in the participants’ hesitation and fear due to a large number of details that are asked about and the lack of Its rationality, the decrease in the participants’ interest in providing serious answers due to the increase in the duration of the interview and their fatigue, an increase in the possibility of errors in data collection, an increase in the complexities of data analysis, distracting the researcher from the processing data and writing the report and thus discussing topics that not related to the objectives of the research and distracting the decision-makers.
The observed cases that may be called rubbish data are uncountable. Asking about the name of the participant in a political poll in which the name of the participant does not matter at all, it only expresses his legal personality as a representative of a sample of the surveyed community groups (except in rare cases related to verification and follow-up of the data collection teams), asking about the participant’s name will necessarily lead to providing answers that stray more from his true opinions, as a result of his fear of linking those answers to his name and exposing him to any harm. I always advise that the questions we ask to be linked to the objectives of our research and not to say, “We wouldn’t lose anything if we ask this question.”
By:
Ghaith Albahr: CEO of INDICATORS

Syrians Online working
Published on: 2018-01-01نُشِرَ بتاريخ: 2018-01-01
Online working doesn’t need the working to stay in the same place, which is make it suitable for Syrian situation, while Syrians can work wherever they move, they only need an internet connection and a computer to continue their work.
Another benefit comes from the income, which it will be in foreign currency, that means higher income comparing to the low prices of Syrian pound. This also brings money to the local market which increases its movement.
Brief of the assessment:
Objectives: This assessment is trying to increase the opportunities of Syrians online working, by screening the available competencies that suitable for such business, and discovering the projects that can be most effective and helpful for them to start working via internet, then share them with the NGOs that interested Syrian employment.
Main themes:
- Syrian competencies for online working.
- Description of the situation of current Syrian online workers.
- Barriers and challenges of online working, especially for Syrians.
- Expectations of growth for online working in Syria.
- Recommended projects to prepare Syrians for online working.
Scope:
The assessment will cover 3 governorates: Idleb, Daraa, and Aleppo.
Will be conducted in January/2018.
Target groups:
The questions concentrate on Syrian youth, females, and people with disability.
Data sources:
- Syrian individuals: to screen the competencies they have for online working, their awareness about it, and the equipment they have for such business.
- Syrian online workers: to provide full stories about some online workers, how they started their work, their monthly salaries, the challenges that face them, their needs to improve their business…
- Online working consultants: to have in depth information about online working, what they recommend for Syrian situation, what they recommend to deal with the challenges of Syrians online working, what kind of trainings Syrians need to be able to start working online…
- Secondary data: to review any research have been done about online working, what are the most demanded services, how online working platforms working, how to manage money transfers…
For those interested in this study and its results:
Click here